To make the experiment a fair test:
- Measuring cylinders kept well apart, to avoid contamination.
- Pipettes kept well apart, to avoid contamination.
- The size of the X will be staying the same.
- The person who looks to see when the X had disappeared will be staying the same every time.
Method:
- Firstly, I will prepare my equipment as indicated in the fair test instructions.
- Then, I will pour out the correct amounts into the measuring cylinders.
- I will then place my hand on the timer, so I am ready.
- While my hand is still on the timer, I will wait to start the timer while the chemicals are being poured in the beaker.
- As soon as both chemicals are poured in, I will promptly start the timer.
- I will then watch the solution carefully as the chemical changes colour, looking for when the X disappears underneath the beaker.
- When the X has fully disappeared, I will press the timer to end the timing.
- I will then record the time and repeat this until my experiment is finished.
Safety:
- I will always be wearing safety goggles.
- I will be as careful as possible while pouring the chemicals, to avoid self contamination.
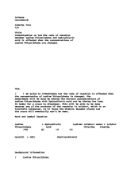
Prediction
My preliminary experiment showed very interesting results, as the rate for the 0.2m experiment is 0.039 and for the 0.04m experiment the rate is 0.008. This means that if you multiply the 0.04m experiment rate by 5 you almost get the rate of 0.2m experiment, this means that from this I can predict that the concentration and rate are linked, if you double the concentration you double the rate and you should get an accurate answer, although not completely correct. Therefore I can predict that as the Sodium Thiosulphate gains concentration the rate will increase.
Rate of Reaction – Rate = 1 / Time
Prediction Experiment
Prediction Graphs
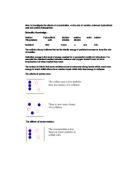
Collision Theory
The collision theory means that if something is highly concentrated, then there is more chance of a reaction because it has more chance of a collision.
High Concentration Low Concentration
These two diagrams show that if something is highly concentrated then the particles have more chance of colliding with other different particles. This is the theory I am basing my experiment on.
Variables
Surface Area: This can effect a reaction because if you are conducting the experiment on a small surface area the particles have more chance of colliding and reacting, compared to a large surface area.
Volume: This can effect a reaction because you can experiment on different type of volumes and they will most likely not give the same times or rate of a reaction.
Catalyst: This can effect a reaction because a catalyst is used to speed up or slow down a reaction.
Shaken or Stirred: This can effect a reaction because if something is shaken or stirred then the chemicals become mixed up and increase the chances of a faster reaction.
Light: The light can effect a reaction because light also generates heat, which speeds up the movement of particles and, therefore, increases the chances of a reaction.
Heat: This can effect a reaction because when you heat something it will often speed up the particles and increase the chance of a reaction, you can use a Bunsen burner for these types of experiments.
Pressure: This can effect a reaction because if something is pressured into a particular area then it often means that there is less room for the particles to move and increases the chance of reaction because they are travelling in such a small area.
Equipment: This can effect a reaction because if you use a Bunsen burner or a lamp then it generates heat etc. There is much more equipment that can be used during an experiment.
Results
X = Not Needed.
Time and Concentration Graph
This Graph shows the main pattern expected.
Rate of Reaction – Rate = 1 / Average Time.
Rate of Reaction and Concentration Graph
Although I have one slight anomaly, the graph shows the pattern expected.
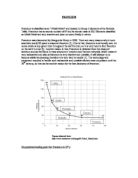
Analysis
Graph Analysis
From my graphs I have concluded that the results show the prediction I expected. My Time and Concentration Graph shows a smooth curve of which I expected. My Rate of Reaction Graph shows a slight anomaly but generally a straight line. This means that the general pattern of the graph was correct. The rate of reaction figures on my graph show that if you double the concentration you approximately get triple the rate. My first graph shows a curve which swoops down to the right, this means that as the concentration increased the time decreased. My second graph shows an anomalous result which means that the line is not quite perfect, however, it gives the general idea of which I predicted. My second graph shows that the rate of reaction becomes faster when there is increased concentration; it shows this by forming a diagonal line, with the line pointing towards the top right corner.
Overall, my results were fairly accurate although there was one slight unexpected result.
Analysis
I have completed my experiment and shown all of the results and graphs. This shows me that I predicted right as the rate of reaction was faster when the concentration increased and also the time decreased as the concentration increased. My tabled results show one or two slight anomalies and my Rate of Reaction Graph also shows one slight anomaly. For my rate calculation I found the average of my two closest times and then used the rate of reaction formula to calculate the rate. I have found out in this experiment that as the concentration of a liquid increases it speeds up the rate of reaction by being able to react more quickly with the other chemical as there is more strength and, therefore, causing each chemical to collide faster; decreasing the time it takes the reaction to take place. The collision theory shows that if you strengthen the concentration of one chemical in an experiment, we strengthened the Sodium Thiosulphate, it makes them react faster by causing them to collide more quickly which is the variable I based this experiment on, and after conducting the experiment this must mean that the collision theory is correct. I also predicted that as you double the concentration the rate would also double; my prediction was very close as the actual results showed that if you double the concentration you will approximately get triple the rate.
Evaluation
In this experiment I have learned that the rates of reaction increase as the concentration does. I had one slight anomaly on my Rate of Reaction Graph; which shows that I must have made an error somewhere, this may have been due to contamination, or lack of concentration. My results showed me that I have done the experiment very well and not much went wrong although I did have one slight anomaly on my Rate of Reaction graph; the rest of the results differed by very little. To improve my experiment I feel I could have tested each concentration more times to make sure I was getting the right results, I may have been able to result in no anomalies if I re-tested the concentrations more times, this would have made my experiment more accurate. I also feel that I could have used a smaller X which I drew on the paper as mine was very large and, therefore, exaggerated my results; this would have affected the rate of reaction if the X had been smaller and, therefore, also shortening the time of the experiment. To conclude, my experiment seemed very reliable but could have been even more so if the possible changes would have been put into effect.