Science Investigation Into What Affects The Resistance Of A Wire
Science Investigation Into What Affects The Resistance Of A Wire
By Owain Bristow 10E3
I am investigating what factors will affect how much resistance a wire will give to a current of electricity passed through it. Possible factors I could investigate are:
* Length of the wire.
* Cross sectional area of the wire.
* Material the wire is constructed from.
* Tension of wire.
* Temperature of the wire.
* Amount of current passed through wire/ amount of voltage.
* Light shining on wire.
I have chosen to investigate the length of the wire used in my experiments, because it is one of the easier ones to do with the equipment available to me and will produce a line graph. Doing a material investigation would yield a bar chart so would not give a complete explanation, it would be quite hard to alter the wire's temperature or try and investigate the effect of light. Changing a wire's tension would also make it thinner and so alter its surface area. I already know by Ohm's Law that in a fixed length and thickness of metal with a constant temperature the current is directly proportional to the potential difference so the resistance is always the same, with it equalling V/I. I have already done several experiments that will help me do this investigation successfully, this includes a simple investigation into current and voltage that has taught me how to set up a circuit correctly and take accurate measurements. I also found out that a rheostat is needed in the circuit to keep the voltage constant, as the power pack's display cannot be relied upon for the actual voltage present. The diagrams of circuits in chapter thirty-one of Physics For You by Keith Johnson have also helped me choose the most suitable method to use.
Prediction
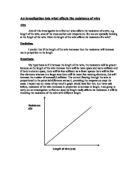
I think that as the length of wire is increased the current will decrease with inverse proportion and therefore the resistance will rise in proportion to the length. Current is a flow of electrons, as the electrons flow through the wire they will hit metal atoms and lose some of their energy, if the wires length doubles there will be double the amount of atoms blocking the way lengthways and the electrons will twice as likely to hit them and slow down. Therefore with more electrical energy being lost the current getting through will be smaller and the resistance will double. My prediction is corroborated in Physics (1991), by Robert Hutchings, which says:
"The resistance R of a piece of material of uniform cross section is found experimentally to be proportional to its length L."
I expect the graph of resistance against length to look like this:
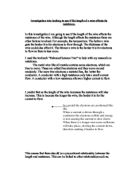
Method
I will use the circuit drawn below in all of my experiments. The ammeter and rheostat will be connected in series to the power pack and the voltmeter connected in parallel to the length of wire being tested, which will be held in place by two crocodile clips. I will turn the pack on at 2 Volts and adjust the rheostat so that the dial on the voltmeter reads exactly this amount. I will then read the dial on the ammeter and record ...
This is a preview of the whole essay
I expect the graph of resistance against length to look like this:
Method
I will use the circuit drawn below in all of my experiments. The ammeter and rheostat will be connected in series to the power pack and the voltmeter connected in parallel to the length of wire being tested, which will be held in place by two crocodile clips. I will turn the pack on at 2 Volts and adjust the rheostat so that the dial on the voltmeter reads exactly this amount. I will then read the dial on the ammeter and record the amount of current passing through the circuit when each different length of wire is used I will repeat the experiment with each length of wire three times then take an average of the current, for greater accuracy. I can then work out the resistance in Ohms (?) by dividing the voltage (2) by the amount of current (I) measured in amps (A). I will then plot a graph of the resistance against length and current against length, if inverse proportion is shown (a curve sloping downwards from left to right), something I expect to occur on the latter graph, I will plot a second graph of length against 1/ resistance. So that the experiments are fair tests I will keep everything the same during them apart from the length of the wire, which is the independent variable. The voltage will always be 2V, the wire tested each time will be made of the same material, constantan, and have the same cross sectional area of 28 S.W.G, which is 0.355mm², and I will make sure I read the dials of the two meters so that the dials are lined up exactly with the reflection. The other wire completing the rest of the circuit will always be made of the same material and have the same length and cross sectional area. The temperature will always be room temperature (~23ºC). I will always adjust the rheostat each time so that the voltmeter reads 2V exactly, because although the power pack may be set on 2V this is not always true for the actual potential difference across the circuit.
I will repeat the experiment on ten different lengths of wire starting at 5cm and going up in 5s to 50cm. This will give be a wider spread of results, which I can plot a graph for. By doing the above experiment I will be able to record the current varying with the length of wire and determine from my graphs how it affects the resistance. This method is the best way to do my investigation because it is relatively simple and will yield quite accurate results. The power pack will give a suitable voltage for the experiments and providing they are read correctly the two meters will show reliable measurements. The cross sectional area of the wire being used is not too thin as it might otherwise melt if too large a current was passed through it.
A
V
My results table will include the length of wire used, the three successive current measurements taken for each length, an average of each one, 1/average current and finally resistance, 2/average current. All my measurements will be given correct to two significant figures.
Safety
To be safe I will use a low voltage during my experiments so that the wire is not burnt (and neither am I) and no equipment is damaged. I will not to electrocute myself, turning the power on after I have let go of the wire. I will make sure I do not short circuit anything. Between experiments I will keep the power pack switched off.
Results
Length Of Wire Investigation
Length of wire (cm)
Current1 (A)
Current 2 (A)
Current 3 (A)
Average Current (A)
/current (A-¹)
Resistance-2/I (?)
5
2.80
2.60
2.47
2.62
0.382
0.763
0
2.00
2.00
.85
.95
0.513
.03
5
.45
.60
.60
.55
0.645
.29
20
.20
.40
.35
.32
0.758
.52
25
.10
.15
.10
.12
0.893
.79
30
.00
.00
0.90
0.967
.03
2.07
35
0.850
0.850
0.850
0.850
.18
2.35
40
0.750
0.800
0.700
0.750
.33
2.67
45
0.700
0.700
0.650
0.683
.46
2.93
50
0.600
0.600
0.600
0.600
.67
3.33
Conclusions
My graph of 1/current against wire length shows that the relationship between the amount of current and the length of wire is inversely proportional, as the wire gets longer less current is able to flow through it. The graph of resistance against length gives a pattern of crosses grouped together closely in an almost straight line showing a strong positive correlation. The gradient of the line on the first graph is 3A ¹/cm, I.E for every centimetre longer the wire gets the current decreases by 0.3 Amps. The gradient of the line of best fit on the second graph is 0.06 ? /cm meaning that for every additional centimetre the wire's resistance increases by approximately 0.06 ?. This means that the resistance in the wire is proportional to its length or R ? L. This supports my original prediction almost exactly, however looking at the resultant graph the line of best fit does not appear to originate from point (0,0), I believe this is because if the length of the wire being tested was zero, resistance would still be present in the other wires and equipment making up the rest of the circuit. Extending the line to the Y-axis shows that the resistance in the circuit without a length of wire being added is about 0.4 ?, or the current is about 1/0.23A.
I think that what I found occurs because of the increased number of collisions in the wire. The current is made up of a large number of free electrons travelling down the wire with electrical energy when there is a potential difference between two points in the circuit. However the atoms of metal present that make up the wire block their path. If they collide with the metal atoms their electrical energy will be converted into heat energy, they will slow down, and less electrical current will pass through the circuit. Therefore if the wire the electrons must traverse is made twice as long twice as many metal atoms will block the flow of current so collisions will be twice as likely and double the electrical energy will be lost as heat. This will halve the current being measured and so double the resistance.
Evaluation
I think the experiments I did worked quite well and enabled me to answer the question as the method I used proved to be a good and fair way of approaching the investigation allowing me to measure a wire's current at different lengths and keep the voltage constant. The results I obtained were enough to answer the original question and all made sense and showed a clear pattern. I think the amount I took over quite a wide range is enough for me to rely on my conclusion. I think my results were quite accurate as I repeated the experiment three times at each length and then took an average, so that if I made an error on one measurement the other two would show me my mistake and lessen it. At each measurement I made sure the voltage was exactly two and that I read the ammeter correctly, lining up the arrow and reflection exactly. I believe the conclusion I have obtained is correct as all my colleagues who did the same investigation as me also got similar straight-line graphs that showed a proportional relationship between resistance and length of wire. My conclusion also agrees with all the Physics books I have drawn information from including Physics, mentioned in my plan, and my textbook Physics For You, which states:
" As the length increases the resistance increases."
The only result that was a bit outside the pattern displayed on the graph was the final one, I believe this might have occurred because as the wire length gets quite long the current becomes very small and is therefore more difficult to measure accurately on the simple ammeter.
To improve my experiment I could increase the number of measurements taken at each stage to remove more error. I could also widen the range of measurements taken by going up to one metre or two metre lengths of wire and instead of going up in five centimetre steps I could go up in fours or even twos or ones. Doing this would give me a larger, more accurate graph that could contain more information to draw conclusions from and show a clearer pattern. By using a digital ammeter I could get results that are easier to read and more accurate and I could also use a more high-tech rheostat. I could carry my results to more decimal places and make sure the length of the wire I use is completely accurate. To get more evidence to support my conclusion I could try the experiment at a different voltage, or keep the current constant or use a different material wire, to see if the results are similar to my present results.
To extend this investigation further I could also investigate the cross sectional the wire and how this would affect its resistance. I could then with the results of both investigations find out whether there is a connection between the length of the wire, its cross sectional surface area and its resistance. I could also investigate the other possible factors such as temperature of wire and materials, with different numbers of free electrons, to find how they affect the resistance and if so, do the results obtained show similar patterns to the length investigation.
According to Physics by Robert Hutchings and other A-Level textbooks the length L, cross sectional surface area A and resistance R of a wire are linked by the formula:
?=RA
L
Where ? is the resistivity constant of the material in Ohm metres, R is in Ohms, A is in square metres and L is in metres. Therefore I can check the accuracy of my results by substituting the values I obtained into the formula to see if the answer matches the actual resistivity of the metal constantan quoted in the book to be 49 x 10