I heated up the acid in the conical flask first until it reached the desired temperature. Next I placed the marble chips in and the delivery tube. I then timed how long it took to collect 50cm cubed of air in the burette. Here are the results of the preliminary.
(write or make up results)
I was careful to make this a fair teat by keeping all variables (apart from temperature) constant. To keep the marble chip surface area the same, I used only large chips. I used the same acid every time to keep the acid concentration the same and always used the same amount of materials.
The preliminary showed that the experiment worked. The timeframe is not too long or short either and can be easily measured. The range is OK, but I must be careful to not go over 70ºC as I spotted some hydrochloric acid vapours, anything over 70ºC would be dangerous. I will make one adjustment to the preliminary by heating the acid separately, and then, when it has reached the desired temperature to pour it in through the thistle funnel into the marble chips. This allows me to start timing the experiment straight away and there should be more accuracy involved. The results from the preliminary fit in with my prediction although more readings are needed.
Obtaining Evidence
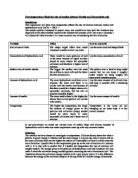
(draw diagram)
I set up the apparatus as shown in the diagram above. I took precautions to wear goggles because I was handling acid. I followed the steps I had laid out in the plan with the changes that I made after the preliminary. I was careful not to start timing as I poured in the acid. This is because the gas released wouldn´t be produced by reaction but the displacement of air by the acid.
To keep this experiment a fair one, I had to keep all variables apart from temperature the same. The variables were:
Amounts of materials used
Surface area of marble chips
Concentration of acid
I made sure I used the same mass of marble chips each time and the same volume of hydrochloric acid too. I used the same concentration of acid every time so the concentration is the same. To keep the surface area of the marble chips the same, I made sure all the marble chips I used were large and therefore had similar surface area.
I repeated the experiment readings twice and took the average to gain a more accurate reading and recorded my results in a table.
Temperature Time taken to fill 50cm cubed with Carbon Dioxide (secs) Average time
(°C) READING 1 READING 2 (secs)
20 35 36 35.5
30 15 17 16
40 12 10 11
50 8 8 8
60 7 8 7.5
70 7 7 7
Analysing Evidence
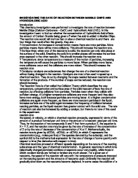
I used the results obtained to plot a graph of the time it took to fill 50 cm cubed with air against the temperature. The graph shows that as temperature rises so does the speed of the reaction. This is due to the kinetic theory. As temperature increases, particles speed up, this happens in the acid and so acid particles collide more with the marble particles and so the reaction happens faster. This fits in with my hypothesis too.
The graph shows a smooth curve which becomes more horizontal as it reaches the higher temperatures. This is because at what ever temperature, the reaction will never be instantaneous.
I conclude that as temperature increases, so does rate of reaction, but the reaction is never instantaneous.
(draw graph using the data given)
Evaluating Evidence
The experiment went quite well. There were no anomalous results and nothing went wrong. Although I have some ideas which may gain an even more accurate reading. Firstly, the surface area of the marble chips were not perfect. It could have been made better if I had used powdered marble chips because the surface area would have been a lot closer. (although if I did use marble chips, the concentration of the acid would have to be weaker because the reaction would be too fast.) Secondly, and inaccuracy may have been caused by the fact that the temperature may have dropped during the reactio