From my preliminary experiment I also justified the use of a burette because it is more accurate than an average measuring cylinder.
Now in the experiment I will observe the times it takes for the cross to be invisible. The times will be compared and I will interpret them by plot them on to graphs and work out averages etc.
I also justified the point of repeating the experiment again for the point and means of accuracy. Then I had more results to draw a conclusion on however the anomalous results I repeated several times. In this experiment there is a good chance of making a mistake therefore I need to repeat to check my results and confirm them.
Method
- Set up the burettes by filling them up each one with acid, sodium thio-sulphate and the last one with water.
- Measure out the different solutions listed in the first row of the table above using a burette. Measure them into test tubes where u can mix the water and thio-sulphate together.
- Mark the paper with a cross and set up a beaker on top of it.
- Pour the mixed solutions into the main beaker.
- Watch the liquid from a birds eye view
- Once u can no longer see the cross, stop the stop watch
- Record the timing in the table above.
- Repeat procedure for the other solutions (next row in table)
Prediction
I predict that when the thio-sulphate is less diluted (more concentrated), there will be more reaction with the hydrochloric acid.
To backup my prediction I will use collision theory.
A chemical reaction will only happen if the particles are colliding together with enough energy. If the energy is not sufficient, the particles just bounce of each other and no reaction occurs. This minimum energy is called the activation energy.
The faster the particles are going, the more energy they have and are more likely to collide.
There are five ways in which the rate of a reaction can be increased:
- Raising the temperature
- Increasing the concentration
- Using a catalyst
- Increasing the surface area
- Increasing the Pressure in gases
If however the opposite of these actions is happening then the rate of a reaction is decreased.
Therefore in the reaction concerning sodium thio-sulphate and hydrochloric acid, the rate of reaction depends on the concentration.
Increasing the concentration of a substance means that there will be more particles per dm3 of that substance. The more particles there are, the more they will collide per second and the rate of reaction increases.
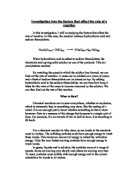
HCI + sodium thio-sulphate = sodium chloride + sulphur dioxide + sulphur + water
Increasing the concentration of sodium thio sulphate means that there will be less time before the cross can no longer be seen (the sulphur will be produced more quickly).
This is what I predict the graph will look like after I do my experiment.
The cross-can no longer are seen because the two substances react and the solution gets cloudy which covers the cross.
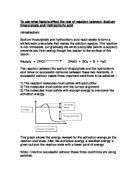
The change in energy can be plotted against the progress of a reaction, as the reactants turn into products.
To break the bonds the start of a reaction, energy is needed. The reactants have to go up the energy scale first before they start reacting.
At the top of the curve, the bonds in the reactants have been broken. The amount of energy that broke these bonds is called activation energy (the minimum amount needed for a reaction to occur). A catalyst works by lowering the activation energy for a reaction.
In the slope of the curve, heat energy is being given out as new bonds form in the products.
The reactants are higher up the energy scales than the products. The amount of energy (heat) you need to put in is less than the amount of heat you get out. This is a typical exothermic reaction.
The difference in energy levels between the reactants and products is given the symbol H.
This is the amount of energy given out during the reaction. For an exothermic reaction it is negative but for endothermic it is positive.
Obtaining
These are the results I gathered from three experiments. I have found out the average in which I will pot my graph on. The results were measured as accurately as possible. I took great care to recheck on time. I made three experiments just to be a little more accurate. The average of the results is found in the last column of the table. I decided to repeat the experiment three times so I could get an average in the end. Because there might have been some variation and the uncontrollable variables might not have been kept constant such as room temperature. By using the average I’ve made sure it’s the middle value and the most common of all experiments.
At the beginning of each experiment I used the same burettes and equipment to measure out each concentration. I took great accuracy in this and rechecked each measurement. I was always the one to check whether the cross-had disappeared because it’s important the same person does it so they can judge whether it’s gone or not. And also I had to determine whether the cross-had disappeared or not. I did this by just deciding on a correct time where the cross was as invisible as the other times I stopped the clock in the other experiments.
Analysis
My results agree with my prediction because I predicted that the lower the concentration of sodium thio sulphate, and the higher the amount of water, the longer the reaction would take to occur.
My graph shows this because it curves down. As the concentration decreases the time increases, indicating that as one factor decreased, the other increased. The graph above shows the line of best fit for the average weights of the times before and after Osmosis in different concentrations of sucrose solution. It clearly shows that the higher the concentration, the less time it takes for the cross to disappear. This graph shows that my first predictions were correct. The graph I drew in the prediction does look similar to the proper one. The line is the same shape.
This is because before two particles can react they must meet. In a low concentration, the particles will be few and widely spread. This means that the number of reactions will be limited because fewer particles will meet. At higher concentrations there are more particles and so they probability of them coming into contact with other particles is increased.
However, not all collisions bring about a reaction. A reaction will only occur if the colliding particles possess more than a certain minimum amount of energy. This is known as the activation energy. (Ea) This activation energy will enable the chemical bonds that already exist between the particles to stretch and eventually break, and atoms, ions and electrons will be rearranged.
Therefore, as I increased the amount of water and decreased the amount of thio sulphate, the reaction will take longer and my graph line will curve down.
Evaluation
I did get some mistakes on my very fist experiment so I had to repeat it all again. Sometimes I also got awkward results.
Overall my experiment was quite good. I repeated anomalous results and got the average plotted on a relative graph. The graph reflects well my prediction. The experiment was easy to carry out and there weren’t many variables to control. We controlled the variables by keeping one concentration constant and changing all the other ones. And room temperature was more or less the same in each experiment. Our preliminary work justified our experiment and equipment so that the experiment flowed accurately.
By repeating the experiment a few times I justified some of the results and patterns that occur within the results. The results seem to follow a particular trend and out of all the experiments I found out an average on which I plotted my graph upon.
To further investigate this experiment, I could use a wider range of times. I used 10, 20, 30, 40 and 50 and so I could use the middle points of these times for more accuracy. I could also go up to 100cm3 to obtain more results but this possibly would not affect my experiment. I could also try working out the rate and working out the concentration as conc to confirm the pattern.
Any number of things such as could have caused this:
- Measuring- the actual measuring of the chemicals is difficult because of the meniscus of the liquid and the accurateness of the measuring cylinders. Also, the human eye causes errors such as this
- The eye could also have made mistakes in judging whether the cross had actually completely disappeared.
- If the same person watching the reaction was working the timer, errors could occur in their co-ordination.
We could remove these errors by:
- Making sure the bottom of the meniscus is read so that it is the true reading.
- Using a burette to measure. This would remove the measuring errors associated with measuring cylinders, as they are correct to 0.1 cm where measuring cylinders are only 0.4. Burettes are a far more accurate way of measuring the correct amounts. This was a good point in my experiment. It made them more accurate than using a measuring cylinder.
- Use light sensors to detect when the cross is no longer visible. The experiment could be connected to a light sensor, and to a timer. These light sensors will detect when there is no light shining through the substance. This would automatically stop the timer and therefore make the experiment fairer and more accurate. See below