The last 2 variables are not applicable to this experiment because the liquids mix so the surface area is always the same, and the pressure will make no difference on the liquids it is only for gases reacting.
Chosen Variable:
Preliminary Results on Variation in Volume of HCl with 20cm Na S O and 20cm of Water.
The variable I am choosing is The Concentration of Sodium Thiosulphate. I have chosen to do this because in the preliminary results of the variation of the volume of HCl did not vary much and so it would not give good results for a graph, there is a bigger margin of error.
To change the Sodium Thiosulphate I will dilute it at certain percentages with water to see what strength produces what RoR.
I will keep the other variable constant by keeping the temperature of both the Sodium Thiosulphate and Hydrochloric Acid, and the water; it should all be at room temperature.
I will also keep the concentration of the HCl constant by not diluting it.
Prediction:
I predict that rate of reaction will increase as the concentration of the Na S O increases, there will be greater RoR; because there will be more particles of HCl to collide with the Na S O so more successful collisions will take place per cm/second. Therefore the liquid will become opaque faster.
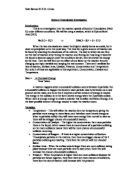
Predicted Graph:
Rate of Reaction
Concentration of Na S O
Apparatus:
- 1 x stopwatch to time the reaction to the nearest second so that the results are as accurate as possible, using analogue clock would be inaccurate because it would not stop.
- 1 x 100cm beaker for using in the reaction, because using a smaller beaker would not fit the liquid in, and a larger one would mean the liquid would not become opaque properly because the liquid would be to thin on the bottom of the beaker.
- 1 x 50cm measuring cylinder to measure the 40cm of Na S O . This is the closest size to the amount being measured so will be easiest to measure it accurately.
- 1 x 10cm measuring cylinder to measure the correct amounts of HCl, again 10cm is the amount we need so this will be the easiest and most accurate to measure it with.
- Safety Goggles, to protect your eyes from the harmful chemicals, if something does get in your eye wash it quickly with clean water then report it too the teacher
- Lab coat, this is in case any chemicals are spilt, this will protect from the harmful ones. Again report spillages to the teacher in charge.
Preliminary Data:
We have decided that the range should be from 10% to 50% because at 10% it approximately 5 minutes and at 50% it takes approximately 1 minute, so this range is good for this experiment in the lab because if the time was any faster it would give unreliable results and if it were and slower we would not have enough time to complete the experiment in the laboratory.
Method:
- Make sure you are wearing safety goggles and a lab coat to protect yourself from the chemicals, because they can corrode or burn skin.
- Collect the apparatus needed and set up as shown in the diagram below.
- Measure out 20cm of Na S O with 20cm of water for the first reading, it will always add up to 40cm so as to keep a fair test, use the 5 cm measuring cylinder for this. And measure out the amount of HCl , this we are keeping constant so will always be 10cm, this we will use a 10cm measuring tube for.
- Take a beaker that can hold 100cm.
- Pour in the Na S O solution and then quickly add the HCl all 10cm at once and start the top watch immediately, give the beaker to swirls, no more because this could create an unfair test.
- Keep the beaker on plain white paper with a black mark on.
- When the black mark is completely obscured by the solution stop the watch.
- Take down the readings carefully in a results table.
- Do this with each concentration of Na S O and then repeat the experiment 3 times to help obtain reliable results, and to help pick out any anomalies.
Diagram:
Results Table:
*Rate = Number of Collisions per Second per Cm
Analysing The Experiment:
In this experiment I have found that when you increase the concentration of Na S O , when mixed with HCl it reacts faster than when the concentration is lower. I repeated each reading 3 times to get the most accurate results I can.
I have drawn up a graph to show the change in volume/concentration of Na S O against the time taken for the liquid to turn opaque and me not being able to see the black dot underneath. The graph has a steady curved line of best fit that shows the time increases more and more as the concentration decreases in equal steps.
Conclusion:
The graph of rate of reaction against concentration Na S O shows an increasing straight line of best fit, this tells us that the rate of reaction increases steadily with almost no curve in the line of best fit when concentration of Na S O is increased.
The graph is proportional because it has a straight line of best fit. As the input variable increases steadily the output variable increases in proportion with it, the output is the rate of reaction and the input is the volume of Na S O in Cm
The reason the rate of reaction increases in proportion to the Na S O, is because when the amount of Na S O goes up there is a higher concentration of Na S O to collide with the HCl, so there is a larger chance of the particles colliding and creating a successful collision. So if there are more successful collisions the mixture will turn the cloudy yellow colour faster.
Evaluation:
This experiment was quite a good success because the results helped me to prove my prediction, the graphs showed good straight lines of best fit with no anomalies.
There are no anomalous results because all the points on the graph fit the line of best fit and they all follow this same pattern so they are all reliable.
The practicality of the experiment is quite easy to perform, but some features do make it difficult to take very accurate readings. The dot underneath the beaker in which the reaction takes place would sometimes vary in size and in shade of black. Using the same dot for every reaction could help this.
The beaker would pick up a residue of Sodium from the reaction, which would make the beaker seem slightly cloudy to start with, so after a few reactions the beaker would begin to build up quite a thick residue, this could be helped by either using a different beaker for each reaction or by cleaning the beaker thoroughly.
Also the light can effect how easy it is to see the dot through the liquid, if there is a bright light in the lab then it will be easier to see the dot through the liquid, so it will take longer the for the dot to be obscured. You could use a light meter to check that the light is always the same when you check for the dot to be obscured.
I don’t feel the evidence is fully reliable, because there are at least 3 things that can be done next time to improve the experiment, I also feel that there is always a margin of human error, but this is hard to eliminate. I think also that taking more results would help to make the graphs and conclusions more reliable.