Equation.
HCl(aq) + Na2S2O3(aq) ⇒ NaCl(aq) + SO2(g) + S(s) + H2O(l)
Sodium + Hydrochloric ⇒ Sulphur + Sulphur + Water
Thiosulphate Acid Dioxide
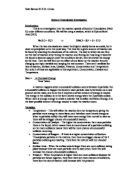
Graph.
This is to show what the final graph may look like.
This graph is to show with the lower concentration of sodium thiosulphate the less time it will take for the cross to disappear I therefore predict that this will look like the graph for temperature increase, and it will be an arch up left for decrease in the temperature.
This graph is from and is to show what the final graph may look like.
Apparatus.
- 2x 250ml conical flasks
- Thermometer up to 100°C
- Paper marked with an ‘X’
- Sodium Thiosulphate solution 50ml (concentration = 40g/litre)
- Hydrochloric Acid 20ml
- Ice Bath (To enable cold readings and tests)
- Boiling Water Bath (To enable warm to hot readings and tests)
- Safety Glasses
- Stop Watch
- 1x 50ml measuring cylinder
- 1x 10ml measuring cylinder
Method.
My first recording of temperature will be at room temperature which will be 15°C – 25°C.
I will firstly measure out 25ml of the sodium thiosulphate solution using the 50ml measuring cylinder. I shall add this to one of the conical flasks making sure that there is no visible contamination is the flask. I will make a recording of the temperature of the contents of the flask, which is the sodium thiosulphate. Then I will mark the paper with an ‘X’ and place the flask on top of the paper so that the ‘X’ ia visible in the centre. I will measure out 10ml of the hydrochloric acid in the 10ml measuring cylinder. I will start the timer at this point whilst adding the hydrochloric acid to the sodium thiosulphate in the conical flask. I will watch over the conical flask with the contents until the ‘X’ I will make a recording of the time it takes for the reaction to happen.
I will repeat the process but place the conical flask containing the sodium thiosulphate in a hot water bath and complete the experiment and redord the reacion time again.
I will do the experiment again but instead of using hot water I will use ice to make the temperature drop dramatically and follow the same procedure.
Then I will revise all of my experiments and carry them out again to see if I can make an average out of the entire of my experiment for the rate of reaction.
Fairness.
I will keep this experiment fair by being as accurate as possible in all experiments with the recordings of temperatures and also the measuring of solutions. Also making sure I start the stop watch as soon as I add the hydrochloric acid to the sodium thiosulphate to make even more accurate recordings of time. I will also ensure that no apparatus is contaminated with any other substances that can alter the reaction.
Safety.
I will make my experiment as safe as possible by making sure all apparatus is away from the bench ends and placed in the centre. Wear safety glasses throught. Make sure my fellow pupils are aware of me when handling and using apparatus. Make sure none of my apparatus is unattended and always in view. Being aware of the equipment of others. Having no obstacles are present to overcome.
Observations & Measurements.
I will make measurements of the liquid very accurately and observe the time and measurements very closely to assure no objects obstruct the flow of experiment.
My observations will test my ideas at the beginning of what may happen by the changes that may occur during the experiment. I will observe all the measurements I take with extreme caution to make sure I get the accurate amount of solution needed. I will take around 5-6 readings and repeat all and find the average for each pair.
Results.
The pairs of temperatures show near the same rates of reaction. There are some pairs that are quite different witch show some anomalies in the experiment either caused by contamination or inaccurate measurements.
Analysis.
In the experiment I have completed I have found that some results were not the same when I made repetitions at the same temperature. The anomalies in the lowest temperature recording may have been caused by false readings by the equipment, but more likely to have been by me the manual operator of the equipment. By this I mean inaccurate measuring or contamination in the conical flasks.
My prediction was wrong about if the temperature rising by ten Celsius that the time for the reaction to take place would divide by two, although some higher temperature did this. My results show that they are no where near dividing by two at all instead the reaction time has around 10 seconds taken off for the lower temperatures.
Evaluation.
This investigation could be made more accurate by using time more efficiently, by not rushing the results and taking measurements more slowly to enable more accurate measures of solution etc. All equipment could be rinsed more thoroughly to employ less contamination is the experiment as I think that most of the inaccurate measures and reaction times were caused by. The investigation to me was not fair as I did not keep to all the points I made about keeping free from any contamination, I can only prove if there was any contamination by repeating the entire experiment again and using more time to complete each recording.
To enhance my experiment recording I could use more detailed information on reactions to see whether my recordings are close to experiments that are the same as what I am doing. More revision on the experiment could be used to see where other people have gone wrong and how they have corrected the anomilie.