Method
This is the procedure that I will use to do the experiment:-
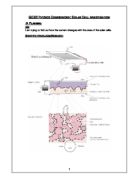
- Set up apparatus as in shown in the diagram.
- Measure the distance from the lamp to the solar panel.
- Test card whether it is opaque or not.
- Set milliamp meter to 200 milliamps.
- Record milliamps shown on milliamp meter.
- Then, repeat the experiment with the following area of the solar panel covered (%):-
7. After that, I calculate the readings for the area of the solar panel uncovered using a PC program called “Microsoft Excel” to illustrate tables and graphs.
Accuracy and Range of Readings
To make this experiment as accurate as possible we needed to make sure that the distance length from the solar panel to the lamp is accurate every time so we checked the distance length was 10.5cm before we started a reading. Also we tried not to keep it too far away because as you get further away, the light from the bulb gets more spread out meaning that less of it hits the solar panel. If it is too close the temperature will affect the readings. Milliamp meter needs to be set at 200 Milliamps at all times. We needed to also ensure that the time intervals between readings were about 10 seconds. The card had to be folded four times to make it fully opaque so no light can pass through. We took the readings of the current immediately so the card wasn’t under the lamp too long which may be a risk to fire. After each reading we turned the lamp off as it may affect the results if we kept it on for too long, which would make the temperature increase. To make my experiment as reliable as possible I will repeat it 3 times and then find an average result
using the ‘arithmetic mean’.
Arithmetic Mean = ∑ x
n
Where:
‘∑’ is a capital Greek letter (sigma). ‘∑x’ means the sum of all the terms and ‘n’ is the number of terms. I will use this formula to calculate my ‘Average Resistance’ and for the ‘mean of graph’ (this allows me to work out the exact point where the line of best fit runs straight through).
Table
This is how my table should look like:-
Fair testing
In this experiment I will only change 1 factor, which is the length of the paper; I would have to change the card placements at the same measurements every time. I will change the length of the card each time from 100%, 75%, 50% and 25%.
The following factors that are going to be kept constant are:
- The distance from the lamp to the solar panel – if this is changed it will affect the light intensity on the solar panel for each reading and the experiment would be unfair.
- The positioning of the lamp – if this is changed, the light intensity on the solar panel would also change therefore making the test unfair. Also the lamps must point at the solar panel only.
- The time – this, would have to be accurate i.e. not leave the solar panel under the lamp for too long or it could affect the temperature from the bulb.
- The Bulb – if the watt of the bulb is changed, the temperature on the solar cell would also change therefore making the test unfair.
Safety
Although this experiment is not very dangerous I still need to be cautious. I have to check if there are any breakages in the wire of the lamp, I must make sure not to touch the bulb as it may be very hot, I must not keep the solar panel under the lamp for too long, I must also not keep the card under the lamp for too long as they could be risks of a fire, and handle with dry hands to prevent electrical shocks.
➔ Obtaining Evidence
Graph – Line of Best Fit
From the graph I can see a fairly straight line up to 50% area uncovered until it gets past that where it curves. There must be an increase in resistance. Current flowing through the conductor may encounter resistance. Any resistance they encounter inside the source is called the internal resistance which has removed energy from the charges before they have a chance to leave the source. This basically means wasting the source’s energy. The temperate from the bulb’s light intensity on the area of the cell could have also affected the increase in resistant. These are some resistant that may affect the wires:-
- The length of the wire.
- The thickness of the wire.
- The material of the wire.
Results Table:
*I have rounded my results to 1 decimal places to allow them become as accurate as possible
➔ Analysis
From my investigation I have found out that using my results and in the graphs that were made from the results, the graph showed as the area uncovered increases the line in the graph does not just go up in a straight diagonal line, it curves, from my research on solar panels (see preliminary work) the curve would be caused by internal resistance inside the solar cell meaning that as more light is put onto the solar panel with the more of it uncovered, more current is being produced, so thus meaning more current will mean more resistance would appear
The graph which was produced shows that up to 50% uncovered it goes up in a straight line meaning that the resistance stays the same up to when 116milliamps are being produced this is the point where the curve in the graph starts to appear implying that the resistance is increasing as the percentage uncovered increases.
My predictions were in some cases correct and the results and graph shows this but also the results shows that some of my predictions were wrong i.e. I predicted the 0% uncovered would be 0, this was correct because no light was to get through and produce a current, my 100% prediction was right but not that accurate, I predicted that the 100% uncovered would be the highest reading and it was and I was almost correct with the predicted reading but I was a few milliamps out. As for my predictions for the 25%, 50% and 75%, these were not correct and not very accurate, this could be for a couple of reasons i.e. the temperature of the light bulb made a change in the readings, as my results were approx 10-15 milliamps out in each prediction. I found all the information that explained the relationship between the resistance and the length; this is why my results agreed with my description of the solar cell.
➔ Evaluation
The method made in the preliminary work, which we further used in the experiment worked well we got all the main points needed to do the experiment, but I think that some aspects used in the method could be changed because this may of changed the results given, this was the distance the light was from the solar panel, it was only 10.5cm, maybe it could of done being around 15-20cm in distance.
The evidence I think was quite reliable because this lead to me completing my results and configuring a graph which looked accurate.
I believe that my results, in general, were reasonably accurate. I know that because I used a milliamp meter which was digitally calculated, instead of an analogue one. My results on the graph lied on a straight line until 50% then after that it had two slight anomalies (circled in red).
I believe that this happened because of the temperature from the bulb. The crocodile clips were not always fixed securely to the wire with a good connection. This also meant that they were easy to move about on the wire, changing the length of it.
I could have improved my investigation to support my analysis by doing other experiments such as the following:
- The distance from the lamp to the solar cell:
I believe that as the distance between the lamp and solar cell is increased, the resistance would decrease. This is because the temperature would not affect the experiment as much.
I think the more uncovered the more resistance there would be due to internal resistance.
- Use a clamp and stand holding a bulb than a lamp for accuracy of the angle the light source is at.
To carry this experiment on further, the tests could be done more times to see if the averages are still the same, to see if there is a change in results if the room is completely dark i.e. so no natural light can interfere with the tests, using a more stronger or sensitive solar panel to pick up the light.