When throwing the quadrats for do not throw them high, far or hard. Check the area before throwing so as not to hit any thing or body.
Method
- At the bottom of the first sand dune take a random sample using the quadrat. To do this throw the quadrat, where it lands is the sample area.
- Using the ID keys, identify the species present in the quadrat.
- Record which species are present.
- Add up the total number of species present and record it.
- Repeat 3 times
- Set the compass along the transect
- Measure 30 meters
- Repeat the above process, using the set compass to keep transect straight.
This is the method used for the trail phase, for the main period of data collection 50m sampling intervals were used due to time limitations. The 50m should be measured 10m at a time. This is because during the trail high winds made it very difficult to use the tape measure over large distances. By measuring 10m at a time the distance is more accurate. Also, measurements should only be taken to the nearest cm as it is made inappropriate by the wind to attempt a higher degree of accuracy.
The number of samples required at each site was determined by a preliminary test. Using the trial data the area with the highest species diversity was estimated to be at the back of the sand dunes. In the area random samples were taken until no new species were found. This occurred after 3 samples therefore that number of samples per site were used for the investigation.
To make the investigation fair all the sample sizes and number of samples per site should be kept the same. By sampling randomly the results are fairer.
Results
Preliminary test for number of samples needed per site
Analysis
Statistical analysis
Null hypothesis: there is no correlation between distance from the first sand dune and number of species present.
I have chosen to use Spearman's rank because it allows me to measures the strength of the relationship between 2 sets of numerical data, in this case metres from 1st dune and number of species found, that do not have a normal distribution curve.
Rs = 1 - 6∑D² = 1 - (6 x 7.5) = 1 - 45 = 1 - 0.0455
n(n² - 1) 10(10² - 1) 990
Rs = 0.955
Where: Rs is the Spearman rank correlation coefficient
D is the difference between the 2 ranks
n is the number of sets of data
Critical values for Rs
When compares to the critical value the Spearman rank coefficient of correlation is much larger. This allows the null hypothesis to be rejected as it proves that there is a significant correlation between the number of species and the distance from the 1st sand dune. The Rs value is positive therefore the correlation is positive. The results are significant at the 0.05 level. This means that the results would have occurred by chance in fewer than 1 in 20 occasions.
The general trend of the results, as shown on the graph, is that the number of species present increases with distance, which concurs with the statistical results. Therefore I conclude that the species diversity increases as the distance form the first dune increases.
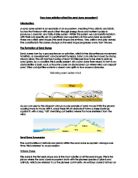
The result could be caused by sand dune succession . Succession is the change from barren land (sand) to a climax community, usually woodland, occuring in several stages.
The first dune is the youngest sand dune investigated. The young dunes are least stable, with a high soil pH and low moister and humus levels (i). These conditions would make it difficult for plants to survive, which why the lowest number of species were recorded between 0 and 100 m. The few plants that can survive are those that are adapted to the environment. E.g. marram grass. Marram grass is xerophyte, to cope with the low moisture levels it has xerophytic features, such as succulent leaves with a thick waxy cuticle. The leaves are also cylindrical and rolled up so the few stomata on the leaves are protected from the wind to reduce water lost via transpiration. Marram grass has an extensive root system than covers a large, shallow area. On the sand dunes the only water source is rain. The water is only available near the surface and drains fast, therefore having a shallow root system covering a large area is an advantage.
Pioneer species, like marram grass, are the first stage of succession. They have a stabilising effect on the sand dunes as their roots bind the sand together. Their dead matter also adds to the humus, creating better quality soil that contains more nutrients and can retain more water. This is the case for the sand dunes between 100 and 250m. Here the conditions are favourable for a larger number of species. These species gradually change the environment until it is no loner suitable for them and more suitable for new species, which then invade the area leading to a more diverse community.
The results at 300 and 350m appear to be anomalies. On investigation this area it was found to be densely populated by rabbits. The decrease in plant species could be because fewer species can cope with rabbit activities like grazing and burrowing.
The dunes at 400 and 450m are the oldest dunes and it is here that the greatest number of species was recorded. In this area plant successions would probably have been occurring for the longest amount of time. The effect of this could be that the area is closest to reaching a woodland climax community, therefore should contain the highest species diversity, which would explain why the results.
The investigation did have limitations. An example of this is the sampling method. Although random sampling increases the fairness of the investigation it probably meant that things were missed. Rare species especially had less chance of being present in one of the quadrats as there is less of them, which would lead to them not being recorded as present in the area so the total number of species would be lower, making the results less accurate. This is true for the sand dunes furthest from the 1st dune, at 450m. This is where the preliminary testing for the number of quadrats required was done. In this test sea sandwort was recorded as present yet in the main data it was not.
The embryo dunes were protected so no sampling could be done there. This limits the conclusion as the embryo dune may not have followed the trend. With no results it can not be proved that the embryo dune do follow the trend, but, from observation, there appeared to be only 1 species present, which indicates that they do follow it, thus supporting the conclusion.
Time limited the size of the area that could be sampled. There was only time to do one transect and the sample intervals were increases from 30m to 50m for the same reason. From the earlier work on the dunes 50m sampling intervals were judged to be sufficient. The sand dunes cover a large area. The profile of the dunes and the position on blow outs and slacks changes though out this area. By only doing one transect the effect of these changes on species diversity could not investigated. Also it allowed only a relatively small area of the sand dunes to be sample. This could reduce the validity of the conclusion. As the results follow the typical pattern of species diversity discovered in research the conclusion drawn is most likely a valid one.
The anomalous results do not limit the conclusion as they were investigated and a reason for them was found, therefore do not effect the conclusion made.
To improve the investigation more time would be needed so more transects could be done. This would show more accurately the effect of distance from the 1st dune has on the species diversity by enabling a larger proportion of the dunes to be sampled. Also, if the embryo dunes could be sampled the results could be used to support, or undermine the conclusion.
Bibliography
- hand outs from Rheidol study centre
- Advance biology, CJ Clegg
- A level biology, Phillips and Chilton
- Discovering the country side:coastal walks, D Bellamy
- An introduction to coastal ecology, PJS Boaden and R Sedd
- A level geography, G Nagle and K Spencer
- www. Alienexplorer.com
- www.goeg.mcgill.ca.html