There are set guidelines by the European Union as to the expected quantities of phosphate in water, these measures are put in place to maintain a balance in the ecosystem. In some European countries, phosphate has been banned in some products, for instance, Switzerland has banned the use of phosphate in pesticides. Full-scale plants recovering phosphates from sewage for industrial recycling are currently operative in Europe at Geesmerambacht Netherlands, Treviso Italy and Slough United Kingdom (). Phosphorus concentrations in some EU rivers have fallen since the mid-1980s, particularly in the largest and most polluted rivers
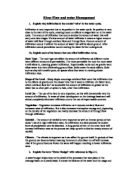
The decline in phosphorus concentrations in major EU rivers is due to improved wastewater treatment and less phosphorus in household detergents. Since May 1999 all Members States have fully or partly transposed this Directive into their national laws and developed implementation plans. (). Figure 1 below clearly shows the decline in phosphorus level in surface water.
Figure (1) Source: EEA-ETC/IW based on country returns under EC Exchange of Information Decision (77/795/EEC)
The phosphorus concentration has fallen significantly over the past 15 years.
Spectrophotometer
A spectrophotometer was used in the determination of absorbance of the sample provided. ‘’ Substances may be identified by its absorption spectrum’’ (Calder A.B). Spectrophotometric and colorimetric are a measure of light transmitted and absorbed over a given wavelength, the concentration of the absorbing solution is determined by the amount of light absorbed. The more concentrated a solution, the more light will be absorbed by the solution. From figure (1), we can assume that there exist a linear relationship between absorbance and concentration.
Beer – Lambert’s law, can best describe the relationship between absorbance and concentration. The law relates the light intensity to the pathlenght in an absorbing medium and the concentration of the solution. This is represented thus;
LogIo/I = A = ecl (1)
Where,
Io = Intensity of incident light
I = Intensity of transmitted light
A = Absorbance
e = Molar absorptivity
c = Concentration of solution (in these experiment mg/l)
l = Length of path through the sample.
There are limiting factors associated with the use of spectrophotometer, this will be enumerated upon in the discussion. In this experiment the concentration of phosphate in river, lake and an unknown water sample will be determined using spectrophotometric methods. To determine concentration in each sample, a colour reagent was added to give a blue colour, the intensity of each colour depends on the amount of phosphate present. The spectrophotometer used for this analysis was Pyu Unicam uv – vis SP 8390
Methodology
Sample preparation
A series of standard solution was prepared from the stock solution, 5, 10, 20 and 40ml were pipette into a 100ml volumetric flask then made to the mark with distilled water. The prepared concentrations were 0.125mg/l, 0.250mg/l, 0.500mg/l and 1.000mg/l.
Colour development
50ml of each standard solution including that of lake, river and unknown water sample were pipette into a conical flask and one drop of phenolphthalein indicator was added. 8ml of the combined reagent was added to each solution and was allowed to stand for 30minutes. This was to allow the blue colour develop, the blank sample was treated as above but turned slightly blue. Phosphate reacts with ammonium molybdate to form (NH4)3PO412MoO4 , the molybdate that is bound with the phosphate forms the blue colour.
Spectrophotometer measurement
The samples were transferred into cuvettes and the absorbance readings were determined using a spectrophotometer (Pyu unicam uv- vis SP8390), the wavelength was set at 880nm. The values are shown in table (1) below.
Results/Calculation
Spectrophotometric and Colorimetric method was used in determining the absorbance of the samples, various absorbance values were obtained from the spectrophotometer analysis, which are shown in table (1) below. The known concentration was plotted against the corresponding absorbance values figures (2,3,4 and 5). A 95% confidence interval was obtained for the accuracy of the spectrophotometer.
Table (1) Spectrophotometric reading and final concentration values for lake, river and unknown water samples (class result)
Where;
UN = Unknown
A = Absorbance
One-way ANOVA: absorbance versus group
Source DF SS MS F P
group 5 355235 71047 0.49 0.784
Error 36 5262417 146178
Total 41 5617652
S = 382.3 R-Sq = 6.32% R-Sq(adj) = 0.00%
Individual 95% CIs For Mean Based on
Pooled StDev
Level N Mean StDev --+---------+---------+---------+-------
1 7 0.0 0.0 (-----------*-----------)
2 7 249.1 433.7 (-----------*-----------)
3 7 236.7 384.3 (----------*-----------)
4 7 272.6 495.3 (-----------*-----------)
5 7 223.0 372.2 (-----------*-----------)
6 7 235.1 396.8 (----------*-----------)
--+---------+---------+---------+-------
-250 0 250 500
Pooled StDev = 382.3
One-way ANOVA: concentration versus samples
Source DF SS MS F P
sampl 1 2 35.98 17.99 11.85 0.001
Error 15 22.77 1.52
Total 17 58.75
S = 1.232 R-Sq = 61.24% R-Sq(adj) = 56.07%
Individual 95% CIs For Mean Based on
Pooled StDev
Level N Mean StDev ------+---------+---------+---------+---
L 6 0.139 0.103 (------*------)
R 6 3.350 2.108 (------*------)
U 6 0.621 0.315 (------*------)
------+---------+---------+---------+---
0.0 1.5 3.0 4.5
Pooled StDev = 1.232
Correlations: concentration, absorbance
Pearson correlation of concentration and absorbance = 1.000
P-Value = 0.000
Regression Analysis: absorbance versus concentration
The regression equation is
absorbance = 2.925 + 197.0 concentration
S = 2.77939 R-Sq = 99.9% R-Sq(adj) = 99.9%
Analysis of Variance
Source DF SS MS F P
Regression 1 24255.6 24255.6 3139.89 0.000
Error 3 23.2 7.7
Total 4 24278.8
Calculation
The concentration values for lake, river and unknown water samples were determined from figures (3,4 and 5), however the values obtained by group 3 in class is different from the actual result obtained from the plot reason being that the final value from class result was estimated roughly without computer generation.
The lake absorbance value is 26;therefore, concentration from figure (3) is 0.12mg/l.
River sample absorbance is 74 before dilution, the concentration from figure (4) is 0.359mg/l, however, sample was diluted by a factor of 10 because of over range during spectrophotometer reading. Therefore, the actual concentration of the river sample is 3.59mg/l.
Unknown sample absorbance is 151; the concentration from figure (5) is 0.751mg/l.
Table 2 concentration values of samples
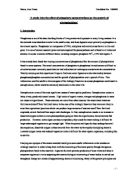
Figure 10
The value above shows how there has been a reduction in the phosphate discharge from sewage treatment plants in rivers in United Kingdom.
Discussion
The spectrophotometric analysis was carried out using prepared standard solutions with known concentrations, different absorbance values were determined for each prepared sample including lake, river and an unknown water sample. However, before the analysis was carried out using spectrophotometer, it was observed visually, the effect of colour change on the samples. This showed clearly that there was a high phosphate concentration present in the river water as compared with the other samples, that is, lake and unknown. The concentrations of both samples lied within the colour range of the prepared standard solutions. From table (1), samples with high absorbance values were intensely coloured than the ones with lower absorbance values (using group 3 values).
The measured absorbance of the standardized solutions was plotted against the known concentrations to obtain a linear relationship, Pearson correlation of concentration and absorbance was determined and there is strong evidence to suggest that there exist a relationship between the concentration and absorbance. A further statistical analysis was carried out using regression, and there was very strong evidence that there is a relationship between absorbance and concentration, this therefore obeys Beer – Lambert’s law. Furthermore, from the equation in figure (9), it can be deduced that an increase in increase in concentration there is also an increase in absorbance. Figure (2) shows clearly this relationship, the various concentration values of lake, river and unknown water samples were determined by extrapolating their absorbance values to the concentration values. This is illustrated in figures (3,4 and 5), the value of river water sample from the calculation above is higher than that of lake and unknown water samples. Figure (8), shows that this method can be used in the determination of phosphate present in water samples, the boxplot show that the degree of spread of lake and unknown water sample lie within the ranges of the standardized solutions. However, the river sample lies above the rest. Therefore this shows that the river sample has a high phosphate concentration.
Class result
The problem with each group was limited, table (1) demonstrate that the result did not vary significantly from one group to another. However, from figure (7) and the statistical values obtained, it is evident that the mean phosphate concentrations for lake, river and unknown water samples are not equal. The mean phosphate level in the river water sample is 20 and 6 times greater than the lake and unknown water samples respectively. A 95% confidence interval level was determined and also the standard deviation, all showed clearly that the phosphate concentrations in the samples are not equal.
Spectrophotometer
The use of Pyu Unicam UV – VIS can be attributed to its ease and speed of analysing samples, and also the absorbance data can be related to concentration. There are limiting factors that affect the reading from the spectrophotometer and these are;
- Lack of precision may arise from the many volumetric transfer of solution from one container to another.
- Stray light causes decrease in absorbance and reduces linearity range of instrument at high absorbance.
- Variation in lamp intensity and electronic output, this may lead to error in the value of the measurement.
- Noise from the uv – vis from the light source and electronic component.
- In absorbance spectrophotometer, at low absorbance that is low concentration, any change in Io will give rise to a significant change in apparent absorbance. At high absorbance very little light is transmitted. (Cairns J. et al)
Standard deviation is the statistical method used in determining the accuracy of a spectrophotometer, from the statistical values obtained and from figure (6), there is evidence that the spectrophotometer reading was accurate. The standard deviation of all groups are almost equal, the spread from figure (6) shows that they are almost equal. There is also a 95% confidence interval that the equipment (spectrophotometer) reading was accurate, this can be attributed to the high p – value.
Conclusion/recommendation
The phosphate level in lake, river and unknown water samples was successfully monitored using the Pyu Unicam UV – VIS. Concentrations in the lake and unknown samples did no exceed the mandatory or guideline levels in European legislation, however, the water sample level far exceed the levels in the past 15 years, as shown in figure (1). Phosphate concentrations between 0.01mg/l – 0.1mg/l is enough to accelerate eutrophication (Peirce J.J et al… 1998). The recommended level acceptable on surface waters by European Union is between 0.22 – 0.3mg/l (Directives 2000 / 60). With the statistical and empirical values obtained, the value of the river water sample far exceed the set levels, therefore, the river water is rich in phosphate.
This experiment has familiarised each group on the working of the spectrophotometer and how it can be used to determine concentrations using the Beer – Lambert’s relation. This experiment shows the relationship between absorbance and concentration, from the statistical data and figures (2 & 9) there exist a relationship between absorbance and concentration.
Recommendation
- Further studies should be carried out on the river water sample so as to inform the appropriate authorities.
- Ion chromatography can be used instead of spectrophotometer because it does not depend on light absorption and colour intensity.
- The Pyu Unicam UV – VIS SP 8390 should be upgraded with a newer version.
References
Andrew D. Eaton, Lenore S. Clesceri and Arnold E. Greenberg (1995) Standard Methods for The Examination of and wastewater. 19-edition pp 4 – 110 America Public Office.
Calder A.B (1996) Photometric Method of analysis pp 115 – 157 Adam Hilger LTD
Clair N. Sawyer, Perry L. McCarty and Gene F. Parkin (1994) Chemistry for Environmental Engineering. pp 596 – 610 McGraw - Hill International Edition.
Faust S.D and Aly O.M (1997) Chemistry of water Treatment 2nd edition pp 474 – 475 Lewis Publishers.
Fifield F.W and Hains P.J (1996) Environmental Analytical Chemistry pp 137 – 144 Blackie Academic and Professional.
Keller R, Mermet J –M, Otto M and Widmer H.M (1997) Analytical Chemistry pp 527 Wiley – VCH.
Pierce J.J Weiner R.F Vesilind P.A (1998) Environmental Pollution and Control 4th edition pp 47 Butterworth Heinemann.
Roy M. Harrison (1992) Understanding Our environment Royal Society of Chemistry.
Tebbutt T .H. Y (1991) Principle of Water Quality Control 4th edition Pergamon Press
Ute S. Enderlein, Raimer E. Enderlein and W. Peter Williams (1997) Water Quality Requirement