The diagram above shows a very thick wire. It shows that a thick wire has a lot of room for electrons to fit easily through making the resistance low.
These are the reasons why I think that the hypothesis may be true. I will now continue with the investigation to prove if they hypothesis is right or wrong.
Background Theory
The background theory of this investigation is as follows:
Current: is the flow of elections round the circuit. Current will only flow though a component if there is a voltage across that component.
Voltage: is the driving force that pushes the current round the circuit.
Resistance: is something in the circuit, which slows the flow of electricity down.
If there is an increase in the voltage the current flow will increase. In addition to if there in an increase in resistance there will be a decrease in current.
Mot wires are made out of metal this is because most metals conduct electricity. However some betters conduct electricity better then others. And example of this would be: copper or aluminum, which have a very low resistance. Or wires made from iron sell have a higher resistance.
The electrons in the outer shell of metal atoms are passed from atom to atom creating an electrical current. Electricity flows thought some materials better others. The term used to see how well something conducts electricity is called its resistance the lower resistant the better the wire conducts electricity.
The diagram above shows electrons in the outer shell of metal atoms
Passing from atom to atom creating an electrical current.
There are many causes for the resistance of a wire these include:
∙ The length of the wire, as the length increase so does the
Resistance
∙ The cross sectional area, as the crossectional area increases the resistance decreases.
∙ Temperature can also affect resistance, as the temperature increase the resistance in the wire increases.
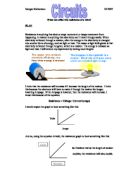
A thicker wire offers less resistance to current than a thinner one of the same material. This is because current consists of electrons flowing through the metal of the wire as shown in the diagram below.
The diagram above its shows the resistance in a thick and thin wire. The black box indicates a battery, with the current (–e) travelling into a thin (blue) and thick (red) wires. The wires in the diagram show electrons flowing through them. From the diagram it is possible to see that there is an immense amount of electrons in the battery. The (blue) wire is thin. In this wire not many electrons can flow through because there is not an absence of space and they wont all fit. Also, the wire is very long which means it will take longer for the electrons to flow through where as the wire underneath is a lot shorter, so the electrons can flow through a lot faster and because the bottom wire is much wider, more electrons can flow through at the same time.
So the wider the wire and shorter the wire, the less resistance it has. In most wires today, copper is used because it is a good conductor. We will be proving this and looking at other wires thickness and length to prove this theory.
Variables
The variables that I will be changing during my investigation are:
∙ Length
∙ Material of wire
∙ Diameter
These three factors have been changed, as they will all be affecting the resistance of the wire, which will hopefully prove of disprove my hypothesis:
Resistance in the wire becomes higher as the length of the wire increases, the resistance varies depending on what material the wire is made out of, the resistance is becomes lower as the diameter (SWG) of the wire increases.
The ranges of wire length I will use in the experiment would be from 20cm to 100cm. The range of diameter of wire that will be use in the experiment would be from 36 to 28 SWG. The material range that will be used in the experiment will be from three types of wire Constantan, Copper and Nichrome.
I will do the investigation on each material, length and diameter twice so I am able to put more plots on my results graphs so I am able to see if there is a clear correlation or not. It will also enable me to make an average of my results and not base my average on one result.
With this I will calculate the gradients and resistance of each wire and put them onto graphs to prove or disprove hypothesis.
I will need to keep all of the other variables constant throughout the investigation as things that would be changed could affect my results.
These include:
The lengths of wire will be kept to the exact size they are suppose to be. If they were not the resistance would be lower or higher then it’s meant to at that length affecting the results.
The same temperature would have to be kept constant by keeping the room the same temperature. This is because different temperatures could affect the resistance of the wire.
The same amount of voltage would have to be used as if it were not it could affect the resistance in the wire affecting the results.
Use the same power box, as it would produce the exact same quantity of electricity unlike a different one, which may produce e slightly more or less.
Plan of method
When I carry out the experiment a number of apparatus would be involved. To make sure that and accurate experiment is carried out I will need the following apparatus:
∙ Power-pack- to provide the electricity to flow around my circuit
∙ Variable resistor- to adjust the flow of electricity to get my results
∙ Ammeter- so that I can see and record the amps and the flowing through the circuit. Wires to connect the circuit
∙ Voltmeter- so that I can see and record the voltage flowing through the circuit.
∙ Meter rule- to attach the wire to and to measure how long each wire is.
∙ Crocodile clips- to attach the circuit wires to the metal wires and complete the circuit
Wire cutters- to cut the metal wires to the right lengths.
∙ Wires- to connect circuit
∙ Various wires:
1. Copper
2. constantion so that I can get my results
3. nichrome
The outline of the procedure is as follows:
Below is a diagram showing the layout of the experiment:
In the investigation “study how different parameters can affect the resistance of a wire.” I had firstly gathered all of my apparatus needed for the experiment:
∙ Power-pack
∙ Variable resistor
∙ Ammeter
∙ Voltmeter
∙ Meter rule
∙ Crocodile clips
∙ Wire cutters
∙ Wires
∙ Various wires:
1. Copper
2. constantion
3. nichrome
I had then set up the experiment as shown in the diagram.
To solve the hypothesis:
Resistance in the wire becomes higher as the length of the wire increases, the resistance varies depending on what material the wire is made out of, the resistance is becomes lower as the diameter (SWG) of the wire increases.
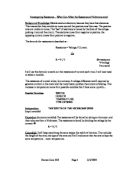
As I had to first see if length of wire can affect resistance I set up the experiment and had cut the wire using wire cutters so I get the exact length I needed for the for experiment either: 20cm, 40cm, 60cm, 80cm or 100cm.However to get a more accurate result and to make the investigation quicker I had placed a 100cm piece of wire on a resistor board and used a crocodile clip at where I wanted the length to be e.g. 40cm. A crocodile clip placed here would only let the current flow from 0 cm to 40cm then goes back round the circuit. I had done this experiment twice so I have more plots and results to put on my graph. This can be seen in the diagram below.
I will do this from 100cm to 20cm with constatent 32. This will help me to see if the resistance went up or down with different types of lengths.
I will then do another test using three different materials:
∙ nichrome 28
∙ Copper 28
∙ constaton 28
These three materials will have all the same SWG (diameter) so it will be fair and the only variable changed would be the material type. With this I will be able to see if different materials have different resistances.
The final test I will do is the change of the different diameters (SWG) of the wire. I will be using constaton 32, constaton 36 constaton 28 and constaton 30. The metal type will stay the same so the test is fair but the SWG will change. This will tell me if the SWG has any affect on the resistance.
All of these tests will be done twice so I will have a large amount of results to pot on my graphs that will be done later in the investigation.
I will plot the results on a graph to find the gradient and the resistance. I will do this using the formula:
X² - X 1
= gradient = resistance
Y² - Y gradient
With this information I will be able to prove or disprove my hypothesis:
Resistance in the wire becomes higher as the length of the wire increases, the resistance varies depending on what material the wire is made out of, the resistance is becomes lower as the diameter (SWG) of the wire increases.
I will record my results to the nearest 2 decimal places.
To make sure the investigation is a fair test and controlled test I will:
-
To keep all the wires the exact same lengths, when the test involves resistance in length size.
-
To keep all the type of metals the same when the test involves the same type of metal.
-
To keep the current flowing at eh same voltage the whole way thought the experiment to the resistance would stay the same.
-
I will keep the temperate the same at all time so that it does not affect the resistance.
- Keep the power pack powered at the same level of power so the current is not high or low when doing the experiment.
Before I did my investigation I carried out a preliminary investigation and all the results are included. The errors in my preliminary investigation were:
- I did not do the experiment enough times.
-
I had only done the experiment once
-
I did not get an average.
-
I have only collected 10 results for each test
-
-
All of these errors have influenced the planning of my investigation because now I will:
-
Do the experiment twice
-
Get 20 results for each test done
- Get an average
The safety precautions that I will need to take are:
-
To stand instead of sting down in case the wires fall onto me or near me
-
To make sure voltage isn’t to high so that it is dangerous.
-
To tie back hair and lose objects so they do not interfere with my experiment.
- To make sure I don’t not touch wire when electricity is passing though.
- To dry hands in case they are wet to prevent an electric
shock.
When I have collected all of my results I will analyse them by putting the data into tables consisting of two headings:
I will analyse them by drawing graphs, adding lines of best fit, working out a gradient and then working out a resistance and plotting graphs of the resistance so that all the data can be analysed In a table easily.
With this I will be able to determine how different materials, lengths and SWG’s of wire can effect he resistance helping to prove or disprove my hypothesis.
By putting the data into tables I can find an average of how different materials, lengths and SWG’s of wire can effect he resistance.