Prediction
I predict that as the concentration of the sodium thiosulphate increases, the rate of reaction will increase. If the concentration increases, there are more particles, therefore there is a higher potential for collisions brings the reaction time down. From this I can also make a quantitative prediction, as if the concentration is doubled, there are twice as many particles, and therefore twice as many collisions meaning the rate of reaction is doubled. Therefore I predict that my graph would look like the diagram below, with concentration on the x-axis and 1/time (seconds) on the y-axis.
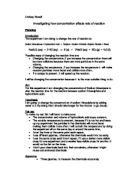
Diagram
Cross Section
Top View
Apparatus
In this investigation I will use the following apparatus:
- Conical flask
- Piece of paper with black cross drawn on it
- Small measuring cylinder for small amounts of water and the hydrochloric acid
- Large measuring cylinder for large amounts of water and the sodium thiosulphate
- Distilled water
- Sodium thiosulphate
- Hydrochloric acid
- Safety goggles
- Stopwatch
- Teat Pipette, one for the sodium thiosulphate and one for the hydrochloric acid
- Larger beaker, one for the sodium thiosulphate and one for the hydrochloric acid
Method
The apparatus was set up as shown in the diagrams above. A beaker was filled up with sodium thiosulphate to ensure the same sodium thiosulphate was going to be used, making it a fair test. This was done for the hydrochloric acid also. The sodium thiosulphate, water and hydrochloric acid were measured in to the measuring cylinders. The re-agents were measured to the bottom of the meniscus and made accurate by using a teat pipette. The sodium thiosulphate was added first to the conical flask, the water was added secondly and then finally the hydrochloric acid was added. As soon as all the hydrochloric acid was added from the measuring cylinder, the stopwatch was started. The conical was viewed from the top and once the black cross could not be seen anymore the stopwatch was stopped and the time recorded. The conical flask was washed out using distilled water and the investigation was done again for a different concentration of sodium thiosulphate. The investigation was done twice for each concentration and the average was taken for the two results that were achieved.
Results
Results One
*= Not enough reactants left to finish the reaction
Results Two
Average Table
Graphs
The graphs below show the average results of results one and two with a 5% error margin and a 10% error margin. The hand drawn graph shows the graph without an error margin and with a line of best fit only.
Conclusion
As you can see from the graph, as the concentration of the sodium thiosulphate increases, the rate of reaction increases. However, the graph does not agree with the quantitative prediction where if the concentration doubles, the rate of reaction is doubled. The hand drawn graph shows that 3 out of 8 points come in contact with the line of best fit. This is not very good but due to experimental error, this can be expected.
Evaluation
Having completed the investigation, there are some things that if had been changed or improved, could have made the factor of experimental error smaller. The graphs with error margins show that 6 out of the 8 points come in contact with the line of best fit in a 5% error margin, where as on the other graph 7 out of 8 points came in contact with the line of best fit in a 10% error margin. This goes to show that experimental error does exist. There was only one anomaly, which was where there was 5cm3 of sodium thiosulphate. If this were done again with a better technique it would come on to the line of best fit.
To reduce experimental error, everything should be kept the same. As people were walking in out of the laboratory, the door was being opened and closed so this meant heat was being lost and so therefore the temperature of the room may have fallen causing the reaction to slow down for some concentrations.
A burette could have been used to measure out large volumes of liquid instead of using a teat pipette when coming up to the required volume of liquid. If a burette was used, this could have ensured sodium thiosulphate came from the same source.