This diagram was taken from the COLFE’S school network under Investigation FACT SHEET 2
Aim
The aim of this experiment is to test the resistance of carbon by changing the length of the line of carbon and the width doing two different types of experiment using a pencil line.
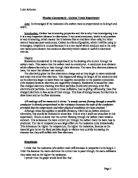
Hypothesis
I predict that the longer the length of the carbon track the higher the resistance will be. They will both be in proportion. I predict that the trend line will be a straight line, which will go through zero. I also predict that there will be some scatter so it may not go straight through the origin. With testing the width I predict that the wider the length of the line the less resistance there will be. In the graph I think that there will be a curve going from high resistance to low resistance. The resistance will be inversely proportional with the width.
Fair Testing
To keep a fair test throughout the experiment will be a challenge but for example when changing the length of the wire I will try to keep the width the same making sure I do not smudge any of the line otherwise the resistance may alter for the wrong
reasons. If this happens this could affect my results. When I choose the method of obtaining my results I also must make sure that I use it the same way all the way through. To make sure that the edges of the sides of the pencil line are straight I will use a guillotine to cut a straight edge.
Other factors I will need to control is the thickness of the line. It might get worn down towards the end of the day. Also it might be rough in some places but smooth in others, which can also affect my results.
Safety
As this is not a very risky experiment there is not much that will be potentially dangerous. The Voltage produced by the Ohm-meter is not big enough to consider as a risk. The Carbon that we will be using is neither harmful nor poison. The equipment we will be using is also not dangerous enough for us to be wearing safety spectacles or anything like that.
Apparatus List
- Paper
- Ohm-meter
- 2 copper wires
- Carbon (in the form of Graphite)
- Crocodile Clips
- Brass plates All different ways of getting readings from
- Jockeys the copper line
- Bent Copper rods
Method
Before I actually carryout the experiment I will have to do some preliminary work. I will test the idea of my hypothesis. I will take three or four preliminary readings then I will compare this with my prediction and see if it is right, if not than I will alter it. Also I will choose which way I want to get the readings whether it is through using copper, a brass plate, crocodile clips or the jockeys. This I will decide on the day on the basis of which one is the most reliable.
Testing resistance in length
- I will do my preliminary work
- I will decide which way I’m going to get my results
- I will draw a reasonably thick carbon line 1.5cm wide on a piece of paper 25cm long
- I will cut off the edges using a guillotine to keep it a fair test
- I will connect the wires to the Ohm-meter
- I will connect the wires to the equipment that I will decide to use
- To get a reading I will touch the line with the apparatus
- I will record my results
- I will take three readings for a fair test
- I will get the average reading
- I will do this for every centimetre
Testing resistance in width
- I will draw a carbon line reasonably thick 15cm long and 12.5cm wide
- I will cut off edges using a guillotine
- I will then take the reading
- I will then cut it again to reduce the width and take another reading
- I will do this again until I have done sufficient readings
- I will take three readings for a fair test
- I will get an average reading
- I will record my results
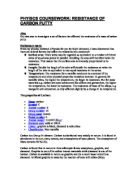
Diagram
This is how I was obtaining my results
OBSERVATIONS: results
As I did not know which method was going to be the most reliable I had to take preliminary readings to see which method was the most reliable. This could be recognised by the one, which had the most repeatability.
As you can see the Jockeys and the brass plates turned out to be reliable. The way I determined which one I was going to use was by looking at the repeatability. The jockeys had the most repeatability so I used them to obtain my results throughout the day.
The table below shows my results when I did resistance v width on a carbon track:
The table below shows the results when I did length v resistance:
Analysis
Conclusion
Width v Resistance
I think that these were a good set of results with some scatter. I predicted that the resistance would go down as I increased the width. As we can see in the graph the trend line starts off at a high resistance. The trend line goes down and the gradient gets less and less. It shows a negative correlated curve. As I said in my introduction the electrons do not collide more if the width is increased but however more electrons can pass through the material with the same voltage. This will increase the current. In my hypothesis I said that the width would be inversely proportional to the resistance. As we can see in the graph, it shows inverse proportionality. I think that my prediction was ‘spot on’ because I said that there would be a curve going from high resistance to low resistance.
Length v Resistance
As you can see in this trend line it is perfectly straight as predicted. It does not go through the origin maybe due to scatter or maybe human error. In my prediction I said: ‘I predict that the longer the length of the carbon track the higher the resistance will be. They will both be in proportion. I predict that the trend line will be a straight line, which will go through zero. I also predict that there will be some scatter so it may not go straight through the origin.’ This in my opinion was a perfect prediction it matches the results exactly. In the graph we can see that there is a straight line. This means that the electron scattering or resistance is proportional to the length of the material or the carbon track.
Both graphs match my prediction. In the length the reason that it is proportional to the resistance is because if you double the length you double the amount of collisions. When you double the amount of collisions it means that more energy is being lost which means more resistance. However when you double or increase the width you do not double or increase the amount of collisions of electrons. When you double the width it does not mean there are more collisions but more electrons to pass through. This will increase the current in the circuit with the same voltage. Therefore as you increase the width you decrease the resistance this means they are both inversely proportional.
Evaluation
I thought the obtaining of results went well. I thought that all of my results were good considering both experiments matched my prediction or hypothesis. This is because I took three results and found the average of these three, which gave me reliable results. There were some anomalous results maybe due to human error but I have circled them in the graphs. This could be for a number of reasons, when we obtain the results the actual carbon track may have had different thickness in it because we had to draw the carbon track manually. This could mean human error in the way I obtained my results. The conditions we worked in were uncontrollable but it did not do enough to alter our results. The temperature would maybe have altered half a degree or so throughout the day.