As the solutions were mixed a stop clock was started immediately to keep the results accurate and the time, which it took for the solution to go completely cloudy until the cross was no longer visible, was recorded into a table.
We than did the same experiment another four times but changing the concentration of thiosulphate each time, and to keep the amount of the solution the same, I had to add a certain amount of distilled water. In the second experiment we added 20ml of thiosulphate and 5ml of distilled water, than 15ml of thiosulphate and 10ml of distilled water, than 10ml of thiosulphate and 15ml of distilled water, and lastly we did 5ml of thiosulphate and 20ml of distilled water. The amount of hydrochloric acid was kept constant, at 10ml, so there was always a solution of 35ml in the conical flask. The results below show the results we got from this preliminary experiment.
The mistakes I made in this experiment, I made sure I did not make them again in the second one. In the secondary experiment I will make sure that I start the clock on time because this will affect my results. Also I will not add such a low concentration of thiosulphate because as you can see by looking at the above results table, the results all have an even gap between them apart from the last one because there is such a weak amount of thiosulphate in the solution. So in the secondary experiment I will add a higher amount of solution than 5ml. In the actual experiment I am going to be very careful when measuring the chemicals to get them accurate and starting the stop clock at the exact time the hydrochloric acid is added to ensure fair and precise results.
To keep the experiment safe I wore goggles at all times to protect my eyes. I used a heatproof mat and tripod when using the Bunsen burner and took extreme caution when turning it on and off. I made sure that all stools and bags were tucked under tables and made sure I was not, at any time running in the lab.
In the secondary experiment, as I have explained above, I will be varying the temperature of the solution not the concentration of thiosulphate and so the method will be slightly different. Instead of changing the amount of thiosulphate, and distilled water, we will change the temperature of the thiosulphate, hydrochloric acid, and distilled water, for each experiment. In the first experiment we will cool down the temperatures of the thiosulphate, hydrochloric acid, and distilled water to 10°C, then to 20°C. We will then heat up the three to 30°C, 40°C, and then finally 50°C.
To keep my experiment fair I made sure that upon repeating the experiment, I used the exact same equipment and done it in the exact same environment to make absolutely sure that the experiment was fair at each temperature.
I think that these were both very important factors because they could affect the results severely and leave me with an anomalous when I should only have correlating results. To ensure fair and accurate results, all of the factors that can affect my results need to be controlled. I need to keep the volume of thiosulphate, hydrochloric acid, and distilled water, the same.
Obtaining And Presenting Evidence
This experiment, just like any other rate of reaction experiment, shows a visible pattern in the results. When I added the solutions together, I observed to check if any changes were visible, to the solution, when we changed the temperatures.
When we did the experiment at low and high temperatures we noticed that the solution turned cloudy but the difference was the speed at which it tuned cloudy. When the temperature was high, the solution tended to go cloudy more quickly, I could not see through the solution at all. I did not see any gas given off, there was no sounds made and the reactions did not fizz violently when it happened.
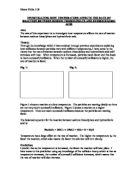
To make my results reliable, I am going to be doing each temperature 3 times, with 5 different temperatures, 10°C, 20°C, 30°C, 40°C, and 50°C. That’s fifteen different results altogether for the temperatures and not including the average results or the results that I made from the five primary results that I record.
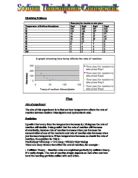
These are the results, which I got from my first experiment as you can see by looking at the table; we added 10ml of sodium thiosulphate, 10ml of hydrochloric acid, and 15ml of water. You can see by looking at the below table that as you move down it (temperature increases) the time taken, for the solution to go cloudy, decreases. You can also see that when you increase the temperature by 10°C, the time taken reduces at a steady rate.
These are the results for the second experiment and as you can see the sodium thiosulphate, water, and hydrochloric acid are all kept the same. You also get similar results in the experiment and therefore a similar pattern in the results but you can see an irregularity. In the last test for this experiment, where we had done the test at a temperature of 50°C, the result has gone wrong, there is an anomalous result. The time at which it should have taken to go cloudy is longer than it should have been. The amount of time it should have taken was about 20-30 seconds, but it had taken 56 seconds, which is longer than it had taken it 40°C.
These are my final results from my final experiment. These results are very similar to the first set of results. The time taken, for the solution to turn cloudy, increases steadily as the temperature decreases, first by roughly 20secs, then 40secs, than 80secs, than 160secs. So the time taken is doubled each time. There is a similar pattern in the first set of results as in this set. There are no anomalous results visible in this table.
This last table shows you the average set of results, of the three experiments and so this table should give the most accurate results. The times given under the “Time Taken” column shows you the average of the times we recorded.
Considering Evidence
By looking at the four result tables above, including the average results, you can see that there is a clear difference between the time it takes for the cross to disappear, when the temperature is high compared to when the temperature is high. All four tables show similar results, which tells us that the experiment was a successful one. There is only one anomalous result, which I will explain later in my evaluation.
This first graph shows the results, which we got from our first experiment. The x-axis represents the temperature (in °C) and the y-axis is the time taken for the reaction to occur (in Secs). As you can see by looking at the above graph there is a clear line of best fit, it has a perfect curve. There is no anomalies easily spotted on this graph and so this experiment was done well.
This second graph shows the results we recorded from the second experiment. This time you do spot an anomalous result and it is actually quite clear. It is the last result we got for this experiment, the time taken should have been less.
This is the last graph and it shows the times we had collected from the last experiment we did. This is probably the most accurate experiment we did, as the points look more in place. It would be our most accurate because we had done the same experiment a few times before, now.
The reaction between Hydrochloric acid and Sodium Thiosulphate
When dilute hydrochloric acid is added to sodium thiosulphate solution, a fine deposit of sulphur is formed. The sulphur makes the solution cloudy. As more and more sulphur is formed, the solution becomes more and more cloudy. Soon it becomes impossible to see through the solution. The balanced equation for this reaction can be seen below.
Sodium + Hydrochloric Sodium + Water + Sulphur + Sulphur
Thiosulphate Acid Chloride Dioxide
Na2 S2 O3 (aq) + 2HCL(aq) 2NaCL(aq) + H2O(l) + SO2 (g) + S(s)
After doing this experiment I have come to the conclusion that the time for the reaction to occur changes if the temperature of a solution is changed. As the temperature increased the time for the reaction to be carried out is more rapid, this is because the energy between the particles increases and so the chance of which the particles collide also increases. This releases the sulphur quicker and in larger amounts, which turned the solution cloudy thus making the cross invisible, a lot quicker.
At the lower temperatures, the time for the cross to disappear was less because the particles did not have as much energy as they did at the higher temperatures. At these temperatures the particles are colliding with a lot less energy and so the reaction that releases sulphur works at a slower pace and now releases less sulphur at a much slower rate thus decreasing the rate at which the cross disappears.
Evaluating
I think that this experiment has gone very well for me. My results were of a particularly accurate standard as I did each temperature three times, and calculated an average from these times. There was only one anomaly within my results table and I think that this was because of the extreme caution and care that I put into making sure that the experiment was set up correctly with careful measuring of chemicals and substances.
My original prediction was that if you increase the temperature of a reaction, you decrease the time it takes to occur. And, from looking back on my results, I can see that this hypothesis was correct as the time for the cross to disappear decreased as the temperature rose. My conclusion matches my prediction very well overall, and my results clearly show this where at a temperature of 10°C the rate of reaction lasted at an average time of 358 seconds, the time for the cross to disappear at a temperature of 50°C was only 35.7 seconds. This is a difference of about 323 seconds. The particles were moving around with more energy; enough to break the energy barrier and for a reaction to occur as the temperature rose.
This anomalous result could have resulted from a number of reasons. It could have been caused because of changes of temperature in the surrounding environment, because the temperature of the solution won’t stay constant. It could have been caused because we may have put a bit too much, or too less of a certain solution. It could have been caused by not being strict with the stop clock; we might have started it too early and stopped it too late. There are also a number of other reasons, which might have caused this anomaly.
I believe that I did get a suitable range of results for this experiment. I recorded results from temperatures that ranged from 10°C to 50° C and I think that this is a very good range to see how temperature affects the rate of reaction. However, I feel that this also reduces the chance of knowing if anything changes if the temperature reaches a certain point. Perhaps doing the temperature even higher would enhance my results but this is also quite dangerous so I cannot really say that I could have improved the range of my results.
Some other areas in the experiment that I feel I could have improved on were factors like controlling the stopwatch and measuring the amount of sodium thiosulphate and hydrochloric acid. There is lots of room for human error here. However the inaccuracies due to them were negligible because I paid close attention to these during the experiment.
I could have improved the experiment dramatically if I had access to better equipment. If we could connect the equipment up to a computer we could use data logging, which will get us very precise and accurate results. We could have also got a better conclusion if we had done the experiment a few more times because then we will have very hard evidence, and can get better averages.
Overall, this investigation has been a very successful one. I feel my results and analysis have been as accurate and reliable as they could have been under the time allocated. However I feel with extra time, I could have repeated the experiment and made it even more accurate and adapted it to try other variables i.e. concentration or adding a catalyst. These are the ways that I could expand on the original question.