Vivian Okrah
Candidate: 9428
Resistance of a wire
Preliminary Work
Aim:
The aim of our investigations is to find out the ohmic limit so I can determine what current I should use in the actual experiment.
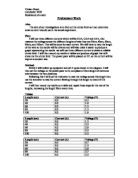
Plan:
I will use three different currents which will be 0.2A, O.3A and 0.5A, then measure the voltage across the different lengths of wire they are 20cm, 40cm, 60cm, 80cm, and 100cm. This will be done for each current. We will have to vary the length of the wire so the results will be diverse and will also make it easier to produce a graph representing the results we will use three different current to obtain a reliable ohmic limit. I will then record my results in tables and produce of graph that will show me the ohmic limit. The power pack will be placed on 2V, so the current will be kept at a constant rate.
Method:
Firstly I will collect up equipment and set it up as shown in the diagram. I will then set the voltage on the power pack to 3v, and place a 10cm length of nichrome wire between the two distances.
Following this I will use the voltmeter to read the voltage across this length then use the ammeter to read the current flowing through this length to check if it is correct.
I will then record my results on a table and repeat these steps for the rest of the lengths, increasing the length 20cm every time.
Tables:
Obtaining Evidence

Analysis
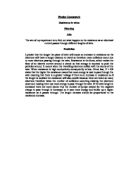
Using the data I obtained from my experiment I was able to calculate the average resistance for each length, and then plot these averages on a line graph.
From analysing my graph, I can see that there is a pattern. Some of the results I recorded from my experiment correspond with my one of my hypothesis, in the beginning of my coursework, which states that the resistance of the wire will increase as the length of the wire increases. But on the other hand it goes ...
This is a preview of the whole essay
Analysis
Using the data I obtained from my experiment I was able to calculate the average resistance for each length, and then plot these averages on a line graph.
From analysing my graph, I can see that there is a pattern. Some of the results I recorded from my experiment correspond with my one of my hypothesis, in the beginning of my coursework, which states that the resistance of the wire will increase as the length of the wire increases. But on the other hand it goes against my second hypothesis which states that doubling the length of the wire will double the resistance, this relates back to Ohm’s law, which says that in electricity, the fact that the amount of steady current through a large number of materials is directly proportional to the voltage across the materials and inversely proportional to the resistance to the current. My graph shows characteristics of being a non-ohmic conductor. I have stated this because, instead of the current being directly proportional to the voltage, which shows that it is a positive correlation, my graph on the other hand begins to level off in the last few lengths of the wire. The points on the graph begin to curve in such a way that increasing voltage produces a smaller increase in the resistance in the current. The points I have circled, are where the it should be increasing but instead begin to level off. This is why they show common characteristics of a non-ohmic resistor, because they to not obey Ohm’s law. So an error has occurred whilst carrying out my investigations.
Resistance of a wire
Theory:
What is resistance?
Electricity is conducted through a conductor, in this case wire, by means of free electrons. The number of free electrons depends on the material and more free, electrons means a better conductor, i.e. it has less resistance. For example, gold has more free electrons than iron and, as a result, it is a better conductor. The free electrons are given energy and as a result move and collide with neighbouring free electrons. This happens across the length of the wire and thus electricity is conducted. Resistance is the result of energy loss as heat. It involves collisions between the free electrons and the fixed particles of the metal, other free electrons and impurities. These collisions convert some of the energy that the free electrons are carrying into heat.
The thin wire in a lamp tends to resist the movement of electrons in it. We say that the wire has a certain resistance to the current. The greater the resistance the more voltage is needed to push a current through wire. The resistance of a wire is calculated by
Resistance (Ω)= Voltage (V)
Current (I)
Ohm’s Law
It is also relevant to know of Ohm’s Law, which states that the current through a metallic conductor (e.g. wire) at a constant temperature is proportional to the potential difference (voltage). Therefore V ¸ I is constant. This means that the resistance of a metallic conductor is constant providing that the temperature also remains constant. Furthermore, the resistance of a metal increases as its temperature increases. This is because at higher temperatures, the particles of the conductor are moving around more quickly, thus increasing the likelihood of collisions with the free electrons.
Effect of Material:
Substances, which allow an electric current to flow through them, are called conductors because of their structure. Copper is a good conductor and is used for connecting wires. Nichrome has more resistance and is used in heating elements of electric fires. Some conductors are better than others. Copper is a better conductor than iron. When electrons are moving through the metal structure they bump into the metal ions and this causes resistance to the electron flow or current. In different conductors the ease of the flow of electrons is different and so the conductors have different resistance.
Effect of cross sectional area:
For a particular conductor the resistance will depend on its length and cross sectional area. The longer the conductor, the further the electrons have to travel, the more likely they are to have collisions with the metal ions and so the greater the resistance. Resistance is proportional to length. The greater the cross sectional area of the conductor, the more electrons available to carry the charge along the conductor’s length and so lower the resistance is. Resistance is also inversely proportional to the cross sectional area. As cross sectional area increases the resistance decreases.
Two wires in series are
one long wire, because
the electrons have to travel
twice as far.
Two wires in a parallel are like
one thick wire so the electrons
have more routes to travel along
in the same distance.
The amount of current flowing through a circuit can be controlled by, changing the resistance of the circuit. This can be done with a variable resistor or rheostat. Adjusting the rheostat changes the length of the wire the current has to flow through. Variable resistors are commonly used in electrical equipment for example in the speed controls on radio’s and hi-fi systems.
Symbol for a variable resistor
(rheostat)
Effect of temperature
If the resistance of a conductor remains constant then a graph showing voltage plotted against current will give a straight line. The gradient of the line will be the resistance of the conductor. However, the resistance of most conductors changes if the temperature of the conductor changes. This can be explained using a simple model of a conductor. As the temperature increases the metal ions vibrate more therefore provide a greater resistance to the flow of the electrons. The resistance of a filament lamp becomes greater as the voltage is increased and the lamp gets hotter.
Planning
Aim:
To investigate how the length of a wire affects the resistance.
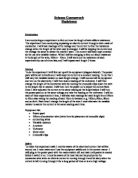
Equipment:
- Power Pack
- Amp meter
- Voltmeter
- Variable resistor
- Wire (with crocodile clips)
- Nichrome wire
Variables
Input:
- Length of wire.
- Material of wire.
- Width of wire.
Output:
- Voltage across wire.
- Current in circuit.
Predictions
- The longer the wire, the higher the resistance. This is because the longer the wire, the more times the free electrons will collide with other free electrons, the particles making up the metal, and any impurities in the metal. Therefore, more energy is going to be lost in these collisions (as heat).
- Furthermore, doubling the length of the wire will result in double the resistance. This is because by doubling the length of the wire one is also doubling the collisions that will occur, thus doubling the amount of energy lost in these collisions.
Method:
The following circuit will be constructed to carry out the investigation.
Firstly I will set up the equipment as a shown in the diagram. I will then set the voltage on the power pack to 3v.
Then the first crocodile clip is clipped to the wire at the 0cm position on the metre rule. The second crocodile clip is clipped to the relevant position depending on the required length of wire. This length for this experiment will be a 10cm increment each time along the metre ruler, which starts from 0cm to 100cm. We decided to use 10cm intervals then testing each increment to get a more reliable set of results and to have more results to compare. The power supply is turned on. The voltage is then read off the voltmeter, and recorded. The power supply is then turned off and the second crocodile clip is moved to the next position.
The above steps will be repeated five times for each length for accuracy
Safety:
In order to perform a safe experiment, a low voltage of 3V was chosen so that overheating will be kept minimal as much as possible. Furthermore, lengths lower than 10cm were not tried, which also helped to avoid overheating, which will lead to anomalous results.
Evaluation
I think my investigation did not go as expected because, I discovered many anomalies when I drew up graph. These were at 70, 80, 90, 100cm. They were circled because they did not increase steadily as expected.
The reasons these problems may have occurred are as follows:
- The power pack may have been left off over a long period of time which allows the Nichrome wire the to cool down causing the wire to have less resistance and therefore leading to anomaly results.
- Perhaps it could have been that the crocodile clips that were attached to the wire may have slipped and become lose therefore not increases the voltage as much as it should be.
- The length that was measured for that particular distance was incorrect. It is possible that the length was shorter, causing a lower resistance and at a majority of the lengths it is possible that it was causing a higher resistance also leading to anomalous results.
We also encountered many difficulties whilst carrying out the experiment such as placing the wire in the 5v hole and then reading the voltage off the line that went up to 15v instead of 5v. So we had to repeat the experiment in order to keep it a fair test.
To avoid these errors in the future I would make sure the power pack would stay on for the same amount off time for each length I would do this by timing it.
An alternative way of doing the investigation would be to use a data logging system which involves digital voltmeter and ammeter and use wire with a larger diameter therefore the clips will not come off easily. I think this would have gave me a more reliable set of results and it would also be a more efficient way of doing the experiment because more time would be saved.