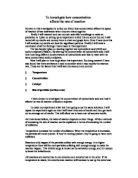
We have decided to run the experiment 5 times, changing the concentration of the Sodium Thiosulphate each time;
In each experiment we will be using the same amount of Hydrochloric Acid, and the same volume of Sodium Thiosulphate Solution. This is to ensure that the experiment is a fair test. We will also take care when measuring out the different chemicals, trying to make them as precise as possible. Using the computer to automatically record the data will eliminate possible human error with the timing and results.
My prediction is that, as the concentration of the Sodium Thiosulphate decreases, the rate of reaction between the two chemicals will also decrease and therefore slow down the rate at which the yellow precipitate is formed. This will mean that in our results, as the concentration of the Thiosulphate drops, it will take longer for the light level to stop dropping and become stable. For a reaction to take place the particles have to successfully collide with each other. As the concentration falls, there will be less Sodium Thiosulphate particles in the solution. This lowers the chance of collisions between the Sodium Thiosulphate and the Hydrochloric Acid particles, and so it also lowers the chance of successful collisions between them.
Results
For our results we have collected data in two formats. Firstly we collected graphs, constructed by the computer which used information from the light sensor. Secondly we took the graphs and recorded the time it took in each experiment, for the % of light to level out and become stable. This data is recorded in the table below.
Analysis
From the evidence obtained I can see that, as the concentration of the Sodium Thiosulphate decreases, so does the rate of reaction. By looking at the graphs, it can be seen that the light level falls at a slower rate when the concentration is lowered. This is because there are less successful collisions between the particles, than there would be at a higher concentration. This results in a slower reaction rate, and so the yellow precipitate takes longer to form properly.
It can also be seen, by looking at both the graphs and the results table, that the time taken for the light to drop and level off, extends as the concentration gets lower. This is again because there are less successful collisions, which subsequently slows down the reaction rate.
Another thing noticeable on the graphs, is the fact that each time we reduced the concentration, the final light level was higher than one with a higher concentration. This is true except for one anomaly where the */* goes slightly lower than the */* concentration. This may be explained by a sudden change in temperature around the beaker, which would have lead to an increased rate of reaction.
All of this evidence supports my prediction that was made at the beginning – ‘As the concentration falls, so will the reaction rate.’ This can also be summed up in a graph, which has a positive correlation;
Evaluation
Our investigation was very successful, and our results supported my predictions.
The evidence collected was of high quality for a number of reasons. We made sure that the experiments were all carried out under the same conditions, or as close to as we could make them. The fact that we surrounded the sensor, beaker and lamp ensured that no extra light from the room would interfere with our results. The use of the computer and the light sensor eliminated the possibility of human error in timing and recording results, which also made the final results more accurate.
However, despite our attempts to control these conditions, there was one anomaly in our results, where one graph crossed over another. This however was most likely due to a change in temperature around the beaker or in the room in general. If I were to repeat this experiment in the future, I would also try to control the temperature of the liquids, by using insulated beakers, or by conducting the experiment in a room with a controlled temperature.
Due to a lack of time, we were only able to conduct each experiment in the investigation once, which could make some of the evidence collected unreliable. To improve the reliability of the evidence we collected, the experiments could have been repeated and an average taken from all of the results.