(in kJ)
C–C = 347
C–O = 358
C–H = 413
O=O = 498
O–H = 464
C=O = 805
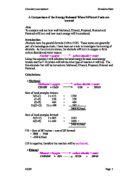
- Methanol:
+ 1½ O=O O = C = O
+
H — O — H
H — O — H
- To calculate the energy taken in when the bonds on the left of the equation above are broken, all the different bonds have to be counted and multiplied by the bond energy for one of those bonds:
C–H x 3
C–O x 1
O–H x 1
O=O x 1½
- When these multiplications are carried out and then totalled, the final value for energy taken in, in this reaction, has been calculated:
413 x 3 = 1239
358 x 1 = 358
464 x 1 = 464
498 x 1.5 = 747
- This number is positive as energy is taken in so it is endothermic.
5. To calculate the energy released when the bonds on the right of the
equation are broken, again all the different bonds have to be counted and multiplied by the bond energy for one of those bonds:
C–O x 2
O–H x 4
6. When these multiplications are carried out and then totalled, the final
value for energy released, in this reaction, has been calculated:
805 x 2 = -1610
464 x 4 = -1856
-3466 This number is negative as energy is released so it is exothermic.
7. Therefore, the value for H is given by:
bonds broken – bonds formed
= 2808 – 3466
= -658 kJ/mole
-
This gives the value for the amount of heat that is released by the alcohol per mole. The same steps are followed, in order to calculate the H for all the remaining alcohols, using the bond energies which have been taken from a chemistry data book.
I have put all the appropriate data regarding bond energies and how these bond energy values relate to each alcohol, into a table (after planning). It also shows the calculated and actual values for H for each alcohol. I have used this table to make certain predictions about the experiment and its results.
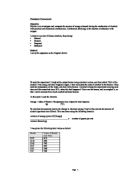
Prediction
In the experiment I am carrying out for my investigation, I predict that as the number of carbon atoms in one molecule of the alcohol increases so will the negative H. This is because when there are more atoms in the alcohol, there are obviously more bonds, because the bonds hold the atoms together. As I stated in the hypothesis, for a reaction to take place the bonds of the reactants have to be broken first. Then the atoms join back together in a different order, to make new products. And breaking bonds requires energy. So when there are more bonds, more energy is required to break those bonds apart. Subsequently, when those atoms form new bonds, new products are made, and even more energy is released.
So if there are more bonds, the relative molecular mass of that substance will be higher. Since the value for the RMM is divided into the mass of alcohol reacted, to get the number of moles, as the RMM value increases, mass of alcohol reacted RMM of alcohol, will decrease. Since enthalpy change is governed by energy released number of moles reacted x 1000, if the value for number of moles, decreases, the overall value will increase.
Overall, this explains that as the number of carbon atoms in one molecule of the alcohol increase, so does the negative H, which represents the heat released per mole of the alcohol. This is because, when the number which we are dividing by, decreases in value, the final value increases. This is because when the number you are dividing by gets smaller, the answer gets numerically greater.
On that account I predict that the line for the experimental values of H, will be directly proportional to the number of carbons in the alcohol, therefore it will be a straight line (as is true with both the calculated and actual values). This is because every time a carbon atom is added, so are two more hydrogen atoms. Although this means that more energy will be required to break those extra bonds, the relative molecular mass will also increase because of the addition of carbon and hydrogen. Ultimately, this will balance out the formula, so the gradient of the line will increase proportionally. However, by studying the explanations of this experiment in the Chemistry text book, I also predict that the line for H from this experiment will be much lower on the graph than the lines for the calculated and actual values of H. This is because there will be a lot of heat loss during the experiment, and there will be errors that do not occur when this experiment is carried out on a larger and industrial scale.
Safety
Prior to carrying out the coursework practical, I have carefully considered all the safety implications and issues involved. As a result I have decided which are the best ways to go about doing the practical. I will ensure that I am wearing safety goggles as this experiment involves a flame and when anything is burning, it can be hazardous and dangerous for the eyes. I will ensure that the experiment is being done on a flat surface top and away from the edge. I will set up the apparatus in the centre of the table or surface top. This means it is well away from the edge of the top, and will therefore prevent the apparatus from falling. This reduces the risk of any glass smashing, as broken glass can be a safety hazard. Also, I will make sure that the container with the water is large enough to accommodate 250cm3 of water, without being too full. I am certain that these safety precautions will help to minimise exposure to any hazards.
Fair Test
There are two variables that are not controlled during the experiment, as these are being investigated. The independent variable is the alcohol itself, as this is what I am going to alter and investigate the effect of. The dependable variable is the amount energy that will be released, which is going to be shown through the loss in mass of the alcohol.
However, in order to certify that the amount of energy released depends totally upon the different alcohols, we have to control all the other variables that would otherwise affect the amount of energy being released. This is so that this experiment remains a fair test.
Initial temperature – the initial temperature of the water will be the same each time, as the water has to be raised by the same number of oC with each alcohol.
Temperature rise – the can with the alcohol in it will be weighed after a certain temperature rise has occurred in the water. Each alcohol will be weighed after the same temperature rise, to ensure that the burning of the alcohols is fair.
Volume of water – this will be kept the same for each alcohol, so that the energy released can be measured fairly. If the volume of water is greater, then more energy will be required to heat the water by a certain temperature. Therefore, to make sure that the alcohols are tested fairly, the same volume of water has to be heated.
Distance between can and flame – this has to be the same for each alcohol as it would otherwise affect the results. If one spirit burner is nearer to the flame, less energy will be released to heat the water by the same temperature rise. This would make the test unfair.
Accuracy
All round accuracy is very important when carrying out an experiment, so that the results obtained are reliable and then truthfully display the trend that should be seen.
-
Firstly, to accurately measure the mass of the alcohol burner at the start and end of the experiment, we will use a digital weighing machine.
-
We are using measuring cylinders to accurately measure out the water that has to be placed into the copper can.
- All the spirit burners contain the same volume of alcohol, so this cannot constitute in making anything an unfair test.
Obtaining Evidence – Table of results
Analysis
By looking at the results I obtained from the investigation, it can be generally seen that as the total number of bonds in the alcohol increased, so did the H. Relating back to the prediction I made in the Planning section of the coursework, I can see that my results agreed with it. I predicted that as the number of carbon atoms in one molecule of the alcohol increases, so will the negative H. This was true because when there was one more carbon added to the alcohol, there were also two more hydrogen atoms added. This increased the overall RMM of the alcohol, which subsequently caused the value for ‘number of moles x 1000’, decrease. As this value reduced, the value for enthalpy change increased because the number I was dividing by got smaller so the final answer got larger. This is also true for the formula where only the ‘mass of alcohol reacted’ is the denominator, because as the RMM gets larger the numerator increases numerically. When the numerator is higher the denominator divides into it more times, so the final value is also higher. This confirms my prediction.
There is another explanation behind the reason of why the enthalpy change increased as the number of carbon atoms in one molecule of the alcohol, increased. When there are more bonds that make up the alcohol, more energy is required to break these bonds up, so that the atoms are free. Subsequently, when there are more free atoms about, more energy will be released when the new products are formed. When bonds are broken, bonds also have to be formed with those free atoms. With the burning of the alcohols, as the number of bonds increases, the energy taken in to break the bonds increases. But the energy released when the new bonds are formed, increases by even more. Consequently, the energy released when bonds are formed, is greater than the energy taken in to break the bonds. So during the experiment, overall, energy is released which means the burning of alcohols is an exothermic reaction. Since it is exothermic, H is negative.
By looking at my graph I can see that it partly fitted in with my prediction that I made in the Planning section. The line representing the experimental values I obtained from the investigation, is a straight line, so the H values are directly proportional to the number of carbon atoms. I originally predicted that the line of best fit would be straight, and this was true, because when a carbon is added two hydrogen atoms are also added, so the RMM increases by 14 each time. Since the RMM increases evenly, so does the final H, which makes it directly proportional to each other and that is why it is a straight line. Therefore, the gradient of the line is positive, and remains the same throughout the graph since it is a straight line. Also, the line for the experimental values is below the lines for the calculated and actual values. This is what I predicted and it turned out to be correct, because it was expected that there would be many errors in this experiment that would cause the overall H values in my experiment, to decrease. This is why the graph is lower than it should be. Heat loss is a significant error that could have caused the H values to be lower than predicted, because there was a lot of heat loss to the surroundings during the heat experiment.
The part of my results that failed to fit in with my prediction was the anomalies I obtained. The values for enthalpy change with Heptan-1-ol and Octan-1-ol were anomalous, and this is not inline with my prediction because I predicted that as the number of carbons increase, the H would get more negative. But in the case of these findings, the enthalpy change values were higher than the alcohols below the, but not high enough to lie on the line of best fit.
Overall, my experimental results are in line with my initial prediction. My prediction was that as the number of carbon atoms in one molecule of the alcohol increases, so will the values for negative H. This trend can be seen from my results. However, I did obtain some anomalous findings within my results, which was expected, as the experiment could not have been carried out without any errors or inconsistencies occurring.
Evaluation
Procedures of experiment
I can say that the experiment was fairly successful in the way that it conveys the correct trend of results, but we did obtain anomalous results. This was because some of the points on the graph did not agree with line of best fit. The procedures we used in order to carry out the experiment ensured that all the necessary variables were controlled so that no other factor except the alcohol itself was affecting the amount of heat released. From this I can accept that the results we obtained should be reliable, as we guaranteed it to be a far test. Also, the results show the trend that I initially predicted, therefore can be considered to be fairly accurate and true. On the other hand, there were bound to be errors which make it difficult to accurately analyse the graph and the results.
Some things that could be done to improve the procedures of this experiment, is to somehow measure the heat that the can itself absorbs during the experiment. This is because not all the heat released when the bonds form, is used to heat the water so more heat than is required is released, which ultimately decreased the value of H.
Accuracy
Although we tried to keep the experiment fair and controlled the variables that were not being investigated and would have otherwise interfered with the results, there were bound to be some inaccuracies and errors. This does not mean that the measurements we took were not accurate, as the errors could be pertaining to other factors involved in the experiment. However, there was always the chance of reading some of the measurements wrong.
Since we only raised the temperature by 10oC, if the temperature was measured wrong by even 1oC, the percentage error would be 10%. Relatively, this is fairly high, which suggests that the higher the temperature change is, the lower percentage error is likely to be. However, it is evident that it would be difficult to raise the temperature by something like 100oC because, firstly it would be extremely time-consuming, and more importantly, the water would boil and turn into a gas. This is why it would have been more appropriate and more accurate to use a temperature change of about 30oC as that is a suitable figure and also reduces the percentage error. That is a way accuracy could have been improved.
Results
Since we carried out the experiment with each alcohol twice, it is important to analyse whether the repeated results were similar to the original ones. It can be seen that the repeated findings I obtained were mostly similar to the ones I got initially. However, with Methanol and Octan-1-ol the two sets of findings were quite far apart. This indicates that these two alcohols gave rogue results. The difference between the first and second set of results with Methanol, was 0.37g. This gives a percentage error of 26.4%, which is relatively high. Also, the two findings I obtained with Octan-1-ol were far apart. The difference between the first and second reading was 0.12g. Although it is lower than the difference with Methanol, it gives a similar percentage error of 26.7%, because the quantity of alcohol reacted is much less in this case. Apart from the rogue results from these two alcohols, it can be seen that the experiment was fairly consistent and reliable because there were no huge differences between the findings I got first time round and the findings I obtained second time round.
However, I obtained some anomalies on my graph. The anomalous values were obtained with alcohols that contained 7 and 8 carbon atoms respectively. These were Heptan-1-ol and Ocatn-1-ol. It can be seen that Octan-1-ol is the alcohol with which I got rogue results and then it turned out to be an anomaly on the graph. It could be that the first reading I obtained was caused by an error, because if it had bee nearer to the second reading, the enthalpy change would have been higher. This would bring the point closer to the line of best fit.
On the graph, the two anomalous points were below my line of best fit, which means that the alcohol released too much energy and it was energy that was not used, which is why the points have occurred below the line and not above it. This is because the difference between the mass before and mass after is more than it needs to be. Therefore, the denominator of the fraction to calculate enthalpy change is higher than it needs to be. If it is higher than it needs to be, then the final answer will be lower than it should be because when the number you are dividing by increases numerically, the answer decreases numerically. Because it decreased, the final value turned out to be lower than it should be, so it occurred below the line of best fit, and got identified as an anomalous result.
However, although there were some anomalous results, this was because the two anomalies were below the line of best fit. Therefore, since they did not lie on the line they were anomalous. But, the predicted trend still remained true throughout the results because as the number of carbon atoms increased, the enthalpy change did in fact continue to get more negative. This meant that methanol had the lowest value, while Octan-1-ol recorded the highest value. But the reason the last two alcohols were obtained anomalous results was because the values were not negative enough to have reached the line of best fit, and hence looked out of place.
One thing that could have caused these discrepancies is the amount of unnecessary heat loss into the atmosphere. More than necessary alcohol was burnt so the difference in mass was higher than it should be. This was because although a certain amount of energy was required to heat the water by 10oC, extra heat was released, because it got lost into the atmosphere. Extra heat was also needed to heat the can itself, which is taken into consideration hen the temperature change of water is measured.
Difference between experimental and actual values
As expected, the experimental results are much lower than the actual and calculated values. Therefore, the line of best fit through my experimental results is lower on the graph, than the line of best fit for the actual values. There are a number of reasons which could have caused these discrepancies and inconsistencies, that ultimately caused the alcohol to release excess heat, which reduced the value for H and recorded them to be less exothermic than they should be.
One very important factor is that heat loss can never be completely avoided. Since we did not measure the time of each combustion of alcohol, if one took longer than another more heat would have been lost. When more heat loss occurs, more energy than what is required is released, which increases the difference in mass of the alcohol. This subsequently reduced the final value for H, and hence the value becomes lower than expected. This clearly indicates that in our expe4riment, there was a huge amount of excess heat loss. This was into the atmosphere, plus the heat that was required to heat the water can itself. Also, during the experiment, a layer of soot began to develop at the bottom of the tin, so as time went on, more heat was released, as heat had to travel through the soot before it could heat the water.
Incomplete combustion is another major problem that reduced the final value obtained. It is difficult to get a good enough supply of oxygen into the apparatus to ensure complete combustion of the alcohol. This is particularly the case with the heavier alcohols, i.e. the ones with more carbon atoms, since more oxygen is required as the number of carbon atoms in the alcohol increases.
One very minute error that can insignificantly affect the results, is a small weighing error due to the accuracy of the balance. However, this will be random, which could lead to either a larger or smaller value than it should be, and this error is very small in comparison to the others.
When the enthalpy change was calculated, we worked out the heat released to raise the temperature of water by 10oC. But we did not include the heat absorbed by the can itself. 250g x 10oC x specific heat capacity of can material, will give a value for the heat released to raise the temperature of the can, which can be added to 10 500 J. This would increase the numerical value of the numerator, and therefore increase the value for enthalpy change. If the values for enthalpy change are higher, they will be nearer to the line of best fit for the calculated and actual values. This increases the accuracy, as they would be closer to the actual results.
Extending the experiment
Although we have identified the inaccuracies with this experiment, there are ways we can extend this particular experiment. One way we could do this is to repeat the experiment again. A third set of findings could be found and this would improve the results because when there are more findings the results become more reliable and accurate. Then the experiment could again be repeated at the points where there were disagreements between the first and second findings, such as with Methanol and Octan-1-ol. This would hopefully wipe out the discrepancies because repeating the experiment would highlight the findings that were anomalous, and the average would become more accurate. Another way of extending this experiment is to carry out the experiment on more alcohols. This would give more points on the graph and improve the line of best fit, as there would be more points that it has to go through.
We could carry out this same experiment, but with a 30oC temperature rise of water each time. This would show whether the trend of H is the same. It is likely that the line of best fit would be even lower than it is with this experiment, because when there is a higher temperature rise, there will be more time for extra heat loss. When extra heat is lost, more alcohol than is needed will be burnt, so the ‘mass of alcohol reacted’ will increase, decreasing the final value. If this is true then the line of best fit will be lower. So by doing this experiment, we will be able to compare the trends.
Overall, by looking at the way I carried out the experiment, I think the investigation was relatively successful as I only obtained two anomalous results on my graph. And although we obtained some anomalies, these were bound to be obtained, as there were possibilities of such inaccuracies and errors occurring. But the trend that I initially predicted did come out to be true. And as I have identified, there are other ways that I could have carried out the experiment, in order to improve the reliability and obtain more accurate results. I have also explained ways in which this experiment can be extended for further study.