The aim of this experiment is to determine how resistance changes as the length of the wire increases.
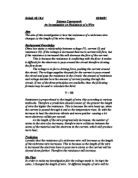
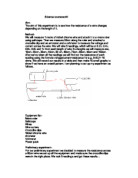
T.Durden 11W GCSE SCIENCE INVESTIGATION - PHYSICS: WIRE RESISTANCEAim: The aim of this experiment is to determine how resistance changes as the length of the wire increases.Planning:Method:A power pack, ammeter (in series), a meter rule (with nichrome wire running down the middle), a voltmeter (in parallel) and wires were taken. There were then connected up as shown above. As seen above, there are two connectors on the meter rule. For ease, they are named clip A and clip B. Once the equipment has been set up, clip B is connected to one end of the meter rule (at 0cm). Then, for the experiment, clip A is moved at 10cm intervals away from clip B. For each interval, two readings (from the ammeter and voltmeter) are recorded, up until 100cm has been recorded. A diagram of the apparatus can be seen in fig 1.1. The wire that has been used is nichrome wire as it does not get very hot when there is high resistance in the wire. The heat caused by high resistance is due to unfixed electrons colliding with positive ions within the wire. These collisions cause the positive ions to vibrate more which in turn causes more collisions, which caused a higher internal energy of the wire, resulting in heat.Theory:Inside the wire there are electrons and positive ions. These positive ions are laid out in a lattice formation and can vibrate but not move out of the lattice grid. Some of the electrons are fixed and some are unfixed, which means that when a current passes through the wire, these unfixed (or free) electrons collide with the positive ions. This is what causes resistance. When current is applied across a piece of shorter wire, fewer collisions take place between the electrons and positive ions within the material. If the length of the wire is doubled, there is double the amount of positive ions in the wire, which means there is a higher resistance because there is a higher amount of collisions.Therefore, the length of the wire is directly proportional to the resistance and because as the length of the wire doubles, the resistance doubles, the following predictive graph can be seen on fig 1.2. And so, based on this, I can predict that the length of the wire is directly proportional to the resistance and therefore as the length doubles the resistance will double accordingly.The quantities that I intend to keep constant is the power supply (2 volts), see preliminary, and
I will vary the length of the wire from a minimum of 10cm to a maximum of 100cm, again, see preliminary.I intend however to change the length of the wire, of which will be tested at each length at different voltages.The equipment that will be used is exceptionally accurate (to within 1/100th of an amp/volt) and this is therefore adequate for our needs. The formula which I will be using is as follows:Resistance (R) = Voltage (V) / Current (I)The number of measurements I intend to take is 1 reading starting at 10cm and at 10cm intervals to 100cm and ...
This is a preview of the whole essay
I will vary the length of the wire from a minimum of 10cm to a maximum of 100cm, again, see preliminary.I intend however to change the length of the wire, of which will be tested at each length at different voltages.The equipment that will be used is exceptionally accurate (to within 1/100th of an amp/volt) and this is therefore adequate for our needs. The formula which I will be using is as follows:Resistance (R) = Voltage (V) / Current (I)The number of measurements I intend to take is 1 reading starting at 10cm and at 10cm intervals to 100cm and one repeat for each reading.Preliminary:A preliminary experiment was carried out for a number of reasons based upon the validity and accuracy of the experiment. One cause of concern was to make sure that the resistance of the wire would not increase on a given voltage, so this was tested using a higher voltage, which then could determine at which point the wire became too hot, resulting in the range of voltages that could be used in this experiment. The circuit diagram for the preliminary experiment is shown in fig 1.3.For the preliminary, to start with, the lengths taken were from 20cm-100cm at 20cm intervals. This gave a standard set of results that had equal intervals. The wire was then tested at 1v, 2v, 3v, 4v, and 5v, based upon the findings from the voltage heat test, which showed that above 8v the wire began to increase in heat and resistance. Another problem that was found was that because the wire had been stored in a coil, the wire when placed on the metre rule kept bending, and therefore for that reason, sellotape was used to fix the wire in position.It took roughly 20 minutes to complete the preliminary experiment, and therefore when the main experiment was carried out, it was possible to do the experiment twice, thus enabling better accuracy with the results (using mean averages).Preliminary Results:Results for 1v:Length (cm)V (V)I (A)R (Ohms)200.070.051.400400.080.042.000600.090.033.000800.100.025.0001000.100.025.000Results for 2v:Length (cm)V (V)I (A)R (Ohms)200.700.531.321400.770.322.406600.800.243.333800.820.204.1001000.840.174.941Results for 3v:Length (cm)V (V)I (A)R (Ohms)201.451.361.066401.590.782.038601.650.553.000801.700.414.1461001.720.354.914Results for 4v:Length (cm)V (V)I (A)R (Ohms)202.262.121.066402.481.232.016602.560.882.909802.620.683.8351002.650.554.818Results for 5v:Length (cm)V (V)I (A)R (Ohms)202.982.911.024403.231.661.946603.361.172.872803.460.903.8441003.540.724.917From these results, it becomes apparent that for the lower voltages of 1v and 2v, there is little fluctuation in the resistance values, and therefore this is the reason why they are not used in the main experiment. A clear depiction of the resistance differences over length and current values needs to be able to be seen, of which for 1v and 2v this is difficult as there is too much weak repetition.Data Ranges:After completing the preliminary experiment, it was decided that the 1v and 2v readings would not be continued, and instead, the readings 3v, 4v, and 5v, would be used. Also, as the results from the preliminary are so small in difference, the intervals between each reading will be shortened to only 10cm. This allows for more detail and accuracy when making judgments about the results.Obtaining Evidence:Results for 3v:Length (cm)V (V) 1stV (V) 2ndV (V) Av.I (A) 1stI (A) 2ndI(A) Av.ResistanceR (Ohms)101.361.381.371.671.711.690.811201.421.491.461.301.321.311.385301.521.541.531.030.971.001.577401.581.591.590.760.810.782.038501.611.621.620.640.670.662.456601.651.631.640.520.590.552.982701.671.651.660.460.450.463.609801.701.711.710.390.420.414.171901.711.721.720.360.370.374.6491001.721.741.730.340.360.354.943Results for 4v:Length (cm)V (V) 1stV (V) 2ndV (V) Av.I (A) 1stI (A) 2ndI(A) Av.ResistanceR (Ohms)102.112.132.122.612.652.630.806202.242.252.252.112.132.121.061302.352.372.361.691.641.671.413402.502.482.491.211.201.212.058502.532.532.531.041.061.052.410602.562.572.570.900.870.892.888702.592.612.600.790.810.803.250802.632.652.640.700.660.683.882902.642.652.650.600.620.614.3441002.652.662.660.540.550.554.836Results for 5v:Length (cm)V (V) 1stV (V) 2ndV (V) Av.I (A) 1stI (A) 2ndI(A) Av.ResistanceR (Ohms)102.712.742.733.563.503.530.773202.982.972.982.912.922.921.021303.113.133.122.312.382.351.328403.213.223.221.681.651.671.928503.313.333.321.411.431.422.338603.383.343.361.181.171.182.847703.403.423.411.041.061.053.248803.473.453.460.880.920.903.844903.503.523.510.790.820.814.3331003.553.573.560.710.730.724.944AnalysisThe first and most obvious statement I can make about the data shown in the above results, based upon the three voltages, is that as the length of the wire increases, so does the resistance. As seen in the results, an average was taken from the two repeats of the experiment. This was done to ensure accuracy. This is also what the resistance was based upon (the averages). The graph that was drawn was based upon the following averages for the resistance, based upon the resistance results from the three separate voltages. These are as follows:Resistance Averages:Length(cm)R (Ohms)3vR (Ohms)4vR (Ohms)5vR(Ohms)Average100.8110.8060.7730.796201.3851.0611.0211.155301.5771.4131.3281.439402.0382.0581.9282.008502.4562.4102.3382.401602.9822.8882.8472.905703.6093.2503.2483.369804.1713.8823.8443.965904.6494.3444.3334.4421004.9434.8364.9444.907These results were used to make the graph attached to this project.As seen on the graph, all of the points ere very close to the line of best fit, this shows that the length of the wire is very closely proportional to the resistance of the wire. The graph also shows that there is a directly proportional relationship between the length of the wire and the amount of positive ions (see theory) within the wire. Therefore as the length increase, so does the amount of positive ions, and therefore the resistance increases. There is a better relationship between the resistance and the positive ions in the wire than simply the wire length and the resistance because the wire still has to go through the rest of the circuit, including the jockey (which is the moving part that determines the length of the wire – it is moved further away from the 0cm mark on the metre rule for a longer wire and moved closer for a shorter wire), and any other object that may cause resistance. Therefore, for every increase or decrease in the wire length, there are additional changes in the resistance external to that of the wire. However, there is also resistance present regardless of the length of the wire, simply due to the content of the wire, which has positive ions in it already, as does most conductors of electricity. This means that there is a resistance level in the circuit regardless if power is even flowing through it. Unfortunately, this means that there is some difference in my predicted graph and the actual graph because the resistance from the external components of the circuit outside that of the wire was not considered when making a predictive graph. This now means that the graph produced may have higher resistances for each length, but as seen will still produce a straight line graph. Evaluation:Firstly, the experiment has proved to be successful in meeting the hypothesis that the length of a wire is directly proportional to the resistance. The method explained has been accurate enough to produce a qualitative graph and results that support this. Secondly, this experiment has proved to be very accurate. The measurements taken were recorded using extremely accurate equipment, which was handled carefully and efficiently during testing. The same equipment was used for each reading, and at no stage was it replaced with another piece of equipment. One example of the accuracy of the equipment is seen in that the averages found for each length of wire was very close to the measurements taken from the individual voltages. This also makes anomalies easy to spot. However, there were no anomalous results or data found during the results, and this is apparent on the graph of which all points are extremely close to the line of best fit. Because the data was so close to the best-fit line on the graph, it shows that the data was reliable enough to support the conclusion that the length is proportional to the resistance. This was also backed by the face that the results were accurately measured, repeats were done and averages taken. This helped reliability by ensuring that all data was accurate, and therefore reliable. However, the reliability was not completely accurate, there were a few minor things that hindered the reliability. One of these is the fact that the wire may not have been straight or perfectly shaped, leaving lumps and bends in the wire that may cause a more compact area of positive ions, and thus a higher resistance. Another small factor was where the wire joined the jockey and other objects along the circuit, on a bad connection this would have caused increased resistance as it limits the flow of electrons.I found the procedure of the experiment was, although successful, appeared to have many factors which could be improved. One of these was the fact the storage conditions of the wire had led to it being difficult to lay it flat, and therefore sellotape had to be applied. Sellotape, being an insulator does not allow the jockey to pass over it, unless being removed. So a new type of fixate should be used to hold the nichrome wire in position. If this experiment was to be repeated, or if one was trying to provide additional relevant evidence, it would be an interesting idea to investigate the resistance changes based upon a material with a different conductive value. E.g. the prospect of using different electrical conductors to see which produce the most resistance. This would be interesting to investigate and would produce a whole new set of data. Physics - Science Investigation