Hypothesis
Using my scientific knowledge of photosynthesis which I have demonstrated before, I can safely predict that as the intensity of light increases so too will the speed of the reaction. Furthermore, I hypothesise that if the light intensity increases, the rate of photosynthesis will increase at a proportional rate until a certain level is reached, and the rate of increase will then go down. Eventually, a level will be reached where an increase in light intensity will have no further effect on the rate of photosynthesis, as there will be another limiting factor, in this case probably temperature.
Apparatus
The equipment I plan to use in this experiment are:
- Elodea
- Sodium Hydrogen Carbonate
- Beaker
- Water
- Clamp Stand
- Capillary Tubing
- Lamp
- Glass Sheet
- Metre Ruler
Variables
Experimental Variable
Light intensity is to be the variable explored in this investigation. Increasing or decreasing the distance from the light source to the plant can vary light intensity.
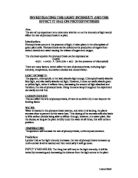
Fixed Variables
Light Wavelength (colour): Light energy is absorbed by pigments in the leaf such as chlorophyll. Chlorophyll easily absorbs blue light, in the 400-450 nm range, and also easily absorbs red light in the 650-700 nm range. Chlorophyll does not absorb green light or yellow light effectively but tends to reflect them, decreasing the amount of light absorbed and decreasing the rate of photosynthesis. How the rate of photosynthesis increases or decreases from the amount of light energy absorbed is what is being investigated in this experiment. The light colour can be fixed by using the same lamp throughout the experiment.
Carbon Dioxide: CO2 concentration can affect the rate of photosynthesis since the more CO2 in the air, the more CO2 that can diffuse into the leaf. This variable can be fixed by adding a fixed amount of sodium hydrogen carbonate to the beaker of water and the plant. The experiment should also be completed in one session and fewer than two hours so the plant does not use up a significant percentage of the CO2.
Water: Water is required during photosynthetic. When plants lack water, their stomata close to prevent further water loss. At the same time, closing the stomata cells doesn't allow CO2 to diffuse into the leaf. Water is also therefore, linked to the carbon dioxide factor. Water can be a fixed variable by keeping the same amount of water in the beaker.
Temperature: Enzymes are used in photosynthesis and the respiration of the plant. Therefore, increasing the temperature will increase enzyme reaction and the photosynthesis rate until a certain point is reached when the enzymes denature. The temperature can be kept somewhat a constant by performing the experiment in one session, when the air temperature shouldn't change enough to affect water temperature. A transparent glass block will also be placed in front of the lamp to retain some of the heat from the lamp.
Plant: Different species plants have different photosynthesis rates due to the different leaf structures of the plants. Even plants of the same species may have slightly different rates of photosynthesis since there may be more or less chlorophyll in the leaves to absorb light. The size of the plant is also important since this would affect the amount of surface area for gas exchange. The only solution to controlling this variable is by using the same plant throughout the experiment.
Limiting factors: Light, carbon dioxide, temperature, and chlorophyll are all limiting factors, meaning that even when there is surplus of every other variable, the rate of photosynthesis will be limited by the limiting factor until there is an optimal amount of the limiting factor to increase the rate of photosynthesis further. Otherwise, the rate of photosynthesis can no longer increase.
Method
We need to find out how the of presence light and the intensity of it contributes to the rate of photosynthesis. To be able to measure the rate we need some type of visible sign that photosynthesis is actually taking place. We will use a type of plant that grows in water and produces bubbles when photosynthesising, in our case, Elodea. By counting these bubbles we can tell how fast oxygen is being given off and therefore produced from photosynthesis. We will place the pondweed in a beaker containing water and also a bit of sodium hydrogen carbonate – NaHCO3 (0.5%). This is put in to provide a steady supply of carbon dioxide. If it wasn’t there, the pond weed wouldn’t get enough carbon dioxide from the tap water to photosynthesise appropriately.
By placing the beaker next to a lamp we can alter the light intensity. We will move the lamp further away every time and then count the number of bubbles that are produced within five minutes.
To start with, the lamp will be placed 800mm away from the glass sheet. Then we will count the number of bubbles produced. This will be repeated a second time to get more accurate results. The lamp will be progressively moved closer in steps of 100mm and the number of oxygen bubbles given off will be measured. Each time, this will be repeated for precise results.
The measurements I will be recording are the time in minutes, the distance in millimetres and the number of oxygen bubbles produced.
The safety points I will be checking are:
* That the stem of the Elodea is cut under water with a sharp knife so it doesn’t get crushed, otherwise the bubbles of oxygen produced will not be able to escape freely.
* That the capillary tube on the clamp stand is stable.
* I will make sure that the desk lamp doesn’t make any contact with the water.
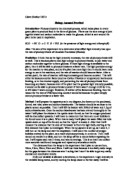
Here is a diagram of what the experiment will look like:
Results
Note: The experiment was done on a sunny day near a window.
The results I collected at the end of the experiment were put in a table:
Analysis
From the results that I have gathered I can state that an increase in light intensity certainly does increase the rate of photosynthesis. This was because photosynthesis is a reaction which needs energy from light to work, so as the amount of energy available from light increased with the rise in light intensity, so did the amount of oxygen produced as a waste product of photosynthesis. From the graphs it is noticeable that the rate of photosynthesis increases at an exponential rate.
My graphs showed that the relationship between the light intensity and the rate of photosynthesis was non-linear, as both graphs produced a best-fit curve. However, it does appear that for the last three quarters of the graph, the increase in rate is in fact proportional to the increase in light intensity (i.e. a straight line) and this can be seen in the first three quarters of graph 2. Here are some of the readings from the results table, from which you can see that there is not much difference, in the number of bubbles from one to another, in the first three quarters of the results.
When measuring light intensity in terms of distance, the greater the distance, the slower the rate of photosynthesis. While the rate of photosynthesis was decreasing, the rate at which it was decreasing at was also decelerating. This is where the line in graph 1 descends more and more as the lamp is moved further away.
The descending of the line in graph 1 can be explained by the fact that light intensity is inversely proportional to the distance squared. This means that as distance increases the light intensity decreases at an exponential rate. If light intensity decreases exponentially, photosynthesis rates that depend on light intensity also decreases exponentially.
As light intensity increases, the photosynthetic rate is being limited by certain factors, such as carbon dioxide and temperature. These factors do not immediately limit the rate of photosynthesis, but rather gradually. As light intensity increases further, so the rate of photosynthesis is being limited by other factors more and more, until the rate of photosynthesis is constant, and so is almost certainly limited in full by another factor.
Overall, all graphs and my results support my predictions fully. My idea that the rate of photosynthesis would increase with light intensity was comprehensively backed by my results.
Evaluation
Although I feel that my experiment was sound overall, I thought there were many points at which the accuracy was not perfect.
Firstly, the distance between the light sources and the Canadian Pondweed were not measured to a very high degree of accuracy, especially when you note the fact that the distance should have been measured exactly from the filament of the light bulb to the centre of the plant. But, we did use a metre ruler and measured the distances to the best we can.
Another error would have been due to background light in the vicinity, especially because the experiment was performed on a sunny day near a window, so we don’t really know how much sun affected this experiment. We also experienced light pollution from other student’s experiments. This would have had a very marginal effect on my results as a whole, but to eliminate this problem completely, it would have been necessary to perform the experiment in a totally dark room with only one desk lamp in the room.
A further inaccuracy was in the heat generated by the lamp. Temperature has a very noticeable effect on the rate of photosynthesis, and so any increase in the temperature of the pond water would have had serious effects on the accuracy of my results. Although we did put a glass sheet in front of lamp, this was not enough and most of the heat most probably went through. To ensure this did not happen, we could have monitored the temperature of the water before and after every reading, to check that the temperature did in fact not rise. Another way of fixing this problem would be to place a Perspex block between the lamp and the plant, which would absorb most of the heat, while allowing the light energy to pass through.
Some of the good points of this experiment were the fact that we repeated each reading, to make the results more accurate, which we then found an average to. We didn’t need to repeat it a third time, since, most pairs of the readings were very similar to each other.
We could have also made a few recordings of the different measurements of the equipment we used and many other things e.g. the power of the bulb in watts. We could have recorded the amount of the Sodium Hydrogen Carbonate poured into the beaker. And we could have also recorded the room temperature.
Although, I believe that this whole experiment should be done over again to solve some of the errors of this experiment, I still believe that it was accurate enough to support and justify my hypotheses. Improvements could have been made as I have stated.
To extend my enquiries into the rate of photosynthesis, I could perhaps try to link in some of the other limiting factors to the same experiment, as well as investigating them in their own right. It could also be interesting to explore the effects of coloured lights on the rate of photosynthesis, which could lead to the question of whether or not other types of light, such as fluorescent lights or halogen lights, would have a different effect on the rate of photosynthesis.
Created By Syed Aminul Islam, 11Q