Celeriac is a member of the carrot family and its large roots contain 7-8% carbohydrate, 0.3% fat, 1.5% protein, and essential oils. Of these, not all are osmotically important. The important solutes are salts and non-reducing sugars.
Pilot Experiment
A pilot experiment was carried out in order to see whether the method was practical and could produce good, reliable results, and to determine the range of concentrations to be used for the main experiment.
Pilot Apparatus List:
Size 3 borer, ruler, scalpel, top pan balance, 5 boiling tubes, 2 10cm3 syringes, stopwatch, absorbent paper.
Pilot Method
- Five tubes of celeriac flesh were cut using a size 3 borer.
- They were measured to 7cm long, and cut with the razor blade.
-
The tubes were placed in 10cm3 of sucrose solution – at 1M, 0.75M, 0.5M, 0.25M and 0M – see dilution table below.
- They were left for three quarters of an hour, then taken out of the boiling tubes, and rolled once on the absorbent paper.
- They were measured again, and the percentage change in length was calculated.
Dilutions
Pilot Results
Analysis of Pilot
A regression line drawn on the graph of the pilot results (see below) shows that there is no change in length when the tubes are in a solution of about 0.7 mol dm-3. This is equivalent to a water potential of –2180 kPa. The results did exhibit a clear trend: the change in mass decreased as the concentration of sucrose rose. With additional repeats and some modifications, this method should produce reliable results.
Improvements to be made for main experiment
In the main experiment, six different concentrations will be used to enable a more reliable graph to be drawn. Because the celeriac tubes vary slightly in density and in water potential, each reading will be repeated four times to give close results. i.e. results within 10% of each other. Any anomalous results will be excluded from the average. Change in length is not a good way of measuring water uptake, because it only accounts for one dimension of the tubes. So, in the main experiment the change in mass will be measured rather than the change in length. The test tubes will be covered in cling film to prevent any evaporation of the water, which would result in an increase in the solute concentration. 45 minutes may not have been long enough to leave the test tubes to ensure that equilibrium had been established, so in the main experiment the test tubes will be left overnight.
Prediction
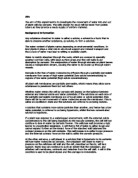
The celeriac tubes are made up of hundreds of celeriac cells. Each one has a partially permeable cell membrane. When the surrounding solution has a higher water potential than the contents of the cell (i.e. in the lower sucrose concentrations), water will move in to the cells, causing an increase in mass when the celeriac tubes are taken out of the solutions. When the surrounding solution has a lower water potential than the contents of the cell (i.e. in the higher sucrose concentrations), water will move from the cells into the surrounding solution, causing a mass loss when the tubes are taken out of the solutions. So I would predict that in the lower concentrations of sucrose solution, the celeriac tubes will gain mass, and in the higher concentrations, the tubes will lose mass. The higher the concentration the more mass will be lost, and the lower, the more mass will be gained. At the point where water potential inside and outside the cell is the same, there will be no net water gain or loss. There will be no percentage change in mass. So the water potential inside the cell will be the same as the solution as the graph crosses the x-axis. Since the water potential of given sucrose concentrations is known, the water potential inside the cell can then be calculated by interpolating on the graph of the water potentials of sucrose concentrations at the concentration where there was no mass change. Based on the pilot results, I predict that the water potential of celeriac will be approximately –2100 kPa. The celeriac tubes cannot go on losing mass forever. At some point, the tubes will become fully plasmolysed and then lose all their water. This is a limiting factor of the mass loss. Equally a cell cannot go on gaining mass for ever, since at some point the turgor pressure will balance out the solute potential and the cell will have Ψ = 0, (i.e., fully turgid) and not gain any more mass, so there is also a limiting factor for the mass gain. Therefore, I would expect a graph of the shape shown below.
Main Experiment
Planning a fair test
Independent variable: Sucrose concentration
Dependent variable: Percentage change in mass
Controlled Variables: starting length of celeriac tubes, starting thickness of celeriac tubes, exposed surface area of celeriac, type and age of celeriac, volume of sucrose solution, time tubes are left in solution, amount of drying on absorbent paper.
- All the tubes will be cut to 7cm long in order to control starting length,
- All the tubes will be cut with a size 3 borer to control starting thickness,
- Using the same length and thickness will control surface area, and the tubes will be cut perpendicular to their length to give an equal "end" area on each tube.
- All 24 tubes will be cut from one large celeriac if possible
-
10cm3 of sucrose solution will be used in all cases.
- All the tubes will be left in their solutions for half an hour.
- The tubes will all be rolled once on the absorbent paper to dry off just the drips of solution.
Apparatus
Size three borer - completely accurate if the same one is used for all 15 tubes
Ruler - accurate to 1mm
Scalpel
Cutting mat
Top pan balance - accurate to 0.01g
Test tubes,
Cling film,
10cm3 syringes - accurate to 0.1cm3
Forceps
Absorbent paper
Risk assessment
Method
- The top was cut off a large celeriac in order to give a flat surface.
- The celeriac was placed flat side down on a cutting mat.
- Using a borer, as many tubes as possible were cut from the celeriac.
- The tubes were cut to 4cm long each using a razor blade and any uneven tubes were discarded leaving the 24 most cylindrical tubes.
- Each tube was weighed on the top pan balance and placed in a test tube, taking care to record the weight of the celeriac tube in each test tube.
- Sucrose solution of concentrations, 0.0M, 0.2M, 0.4M, 0.6M, 0.8M and 1.0M were put into the test tubes. (See dilution table below.)
- The test tubes were left overnight.
- After half an hour the celeriac tubes were removed from the sucrose using forceps.
- They were rolled carefully on the absorbent paper and reweighed.
- The percentage change in mass was calculated and recorded.
- This was repeated to give four results for each concentration.
- In order to produce reliable and accurate results, anomalous results (results more than 10% different from the rest) were excluded from the average.
Dilutions
Results – see separate sheet
Averages
= Anomalous result (excluded from average).
Analysis
The graph of concentration of sucrose solution against percentage change in mass shows the trend predicted - that is, that in the lower concentrations, the celeriac tubes gained mass, and in the higher concentrations, they lost mass. For example, in pure water, the tubes gained an average of 15.34% of their original mass, whereas in 1M sucrose, the tubes lost on average 5.92% of their original mass. This change in mass is water that moved across the partially permeable cell membranes from the areas of high water potential to the areas of low water potential.
The graph shows a curve with a regression line with this formula (calculated using a spreadsheet program, all terms given to 3sf): y = -21.3x2 + 0.125x + 14.9. (A table of x and y values for the regression line is included with the results). This line has been plotted on the graph, and it crosses the x-axis at 0.84. A sucrose solution of 0.84 mol dm-3 has water potential –2760kPa (interpolating from the known values shown in the table and graph above). This is lower than the predicted value of –2100kPa by 24%. Nevertheless, it remains in the same region, and since different celeriacs were used for the pilot and main experiment, biological variation is to be expected.
The predicted effect of plasmolysis – a limiting factor for mass loss was not seen, but since the readings were only continued a further 0.16 mol dm-3 after the first loss of mass it is hardly surprising that the limiting factor does not affect the readings within this range. The predicted limiting factor for mass gain is clearly shown. The gradient of the graph at 0.1M is considerably less steep than the gradient at 0.5M, so this does reflect the fact that the cell was approaching full turgor, and could not continue absorbing water indefinitely, although Ψs in the cell would have remained lower than the Ψ of the very dilute concentrations of sucrose due to the presence of solutes.
It can be concluded that celeriac has a water potential of –2760kPa, as shown by the x-intercept of the regression line drawn using the results obtained by the experiment.
Standard Deviation
Evaluation
This experiment had a successful procedure, and produced reliable data. The data sets are very similar, and the anomalous results were excluded from the average. An average was taken for each molarity in order to minimise the effects of variation between the results, and produce a more reliable result. The graph shows very clear correlation between concentration and percentage change in mass; the regression line does not deviate far from the plotted average change in mass. The spread of results is very small on either side of the regression line, which shows the conclusion based on this line to be very reliable. The error bars drawn on the graph in red pencil show this small spread (the anomalous results are infrequent enough to be discounted). As can be seen on the graph, the best fit line at 0.6M and 0.8M is outside the error bars, so further repeats would be desirable for clarification of those results. The standard deviations are very small – the largest is 0.67, which is less than 6% of the average value. This again shows that the results are very close, and therefore the average values are very accurate. The conclusion of a water potential of –2760kPa rests on the location of the x-intercept. This was difficult to place, because although the three results used to calculate the average at 0.8 were all at 0, the best fit line suggested that the point of no change of mass should be at a higher concentration of 0.84. Further repeats and more readings within the range of 0.7M to 0.9M would help to place this point more accurately – perhaps conducting the same experiment for concentrations of 0.7M, 0.75M, 0.8M, 0.85M and 0.9M and repeating the readings several times to enable a better best fit line to be drawn. However, the difference of 0.04M between the x-intercept suggested by the average values and by the regression line only works out as a difference of 180kPa – a 6.5% discrepancy, which is fairly insignificant.
The experiment was simple to conduct. If more time had been available then it would have been beneficial to repeat the experiment for the 1.0M solution in order to more than two readings to contribute to the average. The anomalous results for 1.0M were very different to the others in the set. They could be accounted for by differing densities of the celeriac tubes, since the consistency of the celeriac varied fairly widely from quite spongy to quite dense. This, or a combination of different factors could account for the discrepancy.
The controlled variables were starting length of the celeriac tubes, starting thickness of the tubes, exposed surface area of celeriac, type and age of celeriac, volume of sucrose solution, time tubes are left in solution, amount of drying on absorbent paper. The starting length of the tubes was measured fairly accurately, but could perhaps have been improved by using a micrometer to measure the celeriac. The starting thickness should already have been constant - since a size three borer cuts to a uniform thickness. If these two factors were controlled, and the ends of the tubes were cut squarely, then the surface area is already constant. The type and age of the celeriac was easily controlled since it was possible to remove all 24 tubes from the same celeriac. The problem was rather the variation in density of celeriac, described above. The best way to minimise the effect of this error would probably have been further repeats, since it is difficult to control the density of the celeriac. The volume of sucrose solution could have been better controlled by using more precise measuring equipment, a Pasteur pipette and filler for instance. The time that the tubes were left in the solution could be more precisely measured if the test tubes were done one at a time, or at least staggered over regular intervals, so that the potato tubes could be put in and taken out at the precise moment. However, since equilibrium should have been established by the time of removing the celeriac tubes, the effect of slight differences in the time the tubes were in sucrose should have been minimal. The amount of drying was also quite hard to control. Since the higher concentrations are more viscous, less solution tended to come off the celeriac tubes, but if gentle and uniform pressure were applied to the tubes as they were dried, perhaps by doing it mechanically, then this would be fairer.
It would be beneficial to do further repeats to find a more accurate average for each result. This experiment could be extended to find out whether a limiting factor was affecting the loss of mass. Using concentrations of up to 1.5M would also enable the point of no change in mass to be seen more clearly. If the dry masses of several 7cm celeriac tubes were taken and averaged, then the total mass of water could be found by comparing this figure to the mass of the tubes before they were dried. Then the percentage of the tube's mass that is water could be found. The experiment could be continued with higher and higher molarities, until the graph had completely reached a plateau. The percentage at which the tubes stopped losing mass could be compared to the percentage of water in the tubes, and if the figures were about the same, then this would prove the hypothesis that a limiting factor was total plasmolysis of the celeriac cells.