Method of squash ball
experiment.
Apparatus
- Bunsen burner
- Squash ball
- Beaker (with 100cm³ water)
- Thermometer
- Tripod
- Tongs
- Heat proof mat
- 1 meter ruler
- Clamp stand
10. Goggles
11. Table surface
12. Assistant
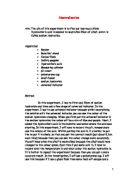
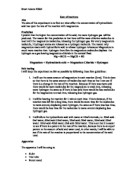
How to set up your apparatus (1a)
Method
- READ & UNDERSTAND ALL THE INSTRUCTION THEN CARRY ON.
- Get all the apparatus needed and set it up like in the diagram (1a).
- Clean the place you are working e.g. move bags
- Place the heatproof mat, then put the Bunsen burner on top of the mat. Place the tripod on top of the Bunsen burner.
-
Put the beaker of 100cm³ of water on top of the tripod, put the squash ball inside the beaker.
NOTE: it will float so use the tongs to duck all of it in.
- Find an assistant because you will need help, it will be hard for you to read off the measurement as well as dropping the ball.
-
Draw a table like in diagram (2b). The table should start from 20ºc not from 10ºc because of the room temperature, but if you do want to start at 10ºc you will wave to put the ball in ice.
-
First soak the ball fully in the water at 20ºc use a pair of tongs.
-
Then with the help of the clamp stand one of you (you or your assistant)? Drop the ball from the top of the 1-meter ruler, on the table.
-
Whilst one of you are doing this the other one should observe the bounce (once) of the ball and see were the top of the ball goes up to on the 1- meter ruler.
- Do the drop three (3) times to get an average reading at the end. Do this constantly with each temperature do not reheat.
- After you have done one temperature go on to the next one and do the same.
- To go on to the next temperature heat the water and the ball with the tongs till you get to the temperature you need, check with the thermometer.
- Do this until you have finished your table
- After you have finished the table work out the average by adding the set of results on a temperature and divide by three e.g.
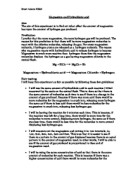
Diagram (2b)
To work out this set of average you add the 1st, 2nd & 3rd results for 10 you would do this 11+12+14= 7 ÷ 3= 12.3
For 20 you would do this 15+16+17=48 ÷ 3= 16
Do this with your results. Then put it on a graph check for the best fit.
I have discovered from my experiment that, the more the ball gets warmer the more higher it bounces. The method I used was good in terms of what I have found out. The method was simple & safe. The results were accurate except one, on the result of 70°C. The results seem different, I still think that the method I used was good but I did an incorrect result. To improve the reliability of the evidence I think I should check the temperature of the ball before bouncing this will give an accurate result. I think I should have attempted the experiment more to get an accurate result. To find an exact result it would be essential to use modern technology e.g. a laser beam to find out where the first bounce is, for this experiment I eye observed the ball. My results show that the more heat is given to the ball the higher it bounces. The general trend is that the first bounce is higher than the second, and the second bounce is higher than the third. It does this because the ball gets colder the second you get it out of the beaker of water, so if you heat the water to 50°C and then get the ball out of the water it will start to go cold because the room temperature is colder than 50°C. You can see this on the graph. But for 70°C it’s the opposite this is an anomalous result. I think I went wrong there so next time I should do it accurately.
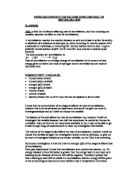
Particles in a solid
Particles in a liquid
Particles in a gas
I have found out that why the ball bounces higher when heat is given to it because everything is made of particles, the particles in a solid are packed together. The particles in a liquid are free to move in a compound shape. The particles in a gas are free to move, when heat is given to these particles they gain energy and move faster. The particles in a squash ball are packed together so when heat is given to it the particles gain energy and they start to collide and make the ball bounce higher. The prediction that I made was right, to the evidence I have found. The only problem is that the experiment went a bit wrong when I did the 70°C results, I think I plotted the results wrong. My results support my prediction.
The patterns I can see on the graph is that the first test result is higher than the last test result because the ball gets colder.
As the temperature increases, the higher the bounce is.
The graph is almost straight at 60°C but at 70°C the graph twists. There is a great jump at 100°C.