Method:
We used the cylinder bore to cut a cylinder of potato. We then measured it and noted the size of the potato down. We then placed the cylinder of ain our Petri dish. We used the syringe to get the solution from the bottle to half cover our pieces of potato we are then going to leave it for 2 days to see what would happen this was then noted down in a results table. This procedure was repeated for 1M,0.75M,0.5M,0.25M and 0.1M sugar solutions
Results:
I think my last experiment will influence this experiment because I now know what things to do differently i.e. check the exact length twice I will do this both before and after my experiment.
Prediction
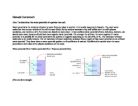
I predict that the higher the water solute potential and the lower the sugar solute potential (meaning water will move out)the cell will become smaller and plasmolysed (shrivelled). The higher the sugar solute potential and the lower the water potential (meaning the water will move in) . The cell will become larger and turgid (swollen). If the water potential and sugar potential are equal the cell will stay the same .
Diagram
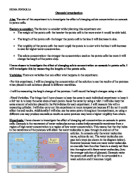
Method:
We are going to use a potato bore to cut fifteen pieces out of a potato they will be measured to the length of 20mm. we are going to place three pieces in each Petri dish. We are then going to cover each dish in one of five sugar solutions (1m,0.75M,0.5M,0.25M and 0.1M). We are then going to leave them for two hours to see what happens this is then going to be noted down in a result table. We are going to perform this experiment for each solution.
Fair test
- We are going to measure the potato three times
- We are going to use the same potato bore when we cut the cylinders of the potato
- We are going to use the same amount of solution each time
Risk assessment
We are going to be careful when using the potato bore
Results
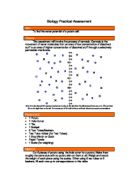
Conclusion:
From my results I can tell that in terms of molarity the 0.5 molar is approximately the same as the potato cells ,this can be told because the potato cell didn’t change size which is shown in my results table. Which shows my prediction is correct because when the molarity was too high the cell became plasmolysed and when it was too low the cell became turgid . The cells became playmolysed in the 0.1M and 0.25M sugar solutions, and the cells became turgid in the 0.75M and the 1M sugar solutions. The graph I have drawn shows a negative correlation.
Evaluation:
I think that the experiment went extremely well because I didn’t have any anomalies and also I think that my results were accurate because they are consistent I can prove this from my results table and my graph both showing the results from the experiment (but in different ways).in my next experiment I would use more than 5 different solutions to make them even more accurate.