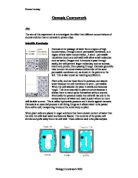
When the potato cores are placed in distilled water, there is a higher concentration of water outside the cell in comparison to inside. Water moves across the semi permeable membrane down the concentration gradient into the cell by endosmosis – from a higher concentration of water to a lower concentration of water. The cell will increase and size and therefore become turgid.
In 0M of sucrose solution (distilled water) water will move in the cell across a semi permeable membrane and become turgid and increase in volume.
In 0.25M of sucrose solution water will move into the cell across a semi permeable membrane and become turgid and increase in volume.
In 0.5M of sucrose solution it would remain the same water does not move into the cell or outside the cell so the volume remains the same.
In 0.75M of sucrose solution water will move out of the cell across a semi permeable membrane and decrease in volume – plasmolysis.
In 1M of sucrose solution water will move out of the cell across a semi permeable and decreases in volume – plasmolysis.
The amount of osmosis that can occur in potato cells may differ in different potatoes. This would mean that in some potatoes the volume reached might be lower or higher than others before the volume starts to level off. This could be owing to some potatoes containing cells with higher (or lower) water content than the cells in other potatoes.
Method
In my investigation I am investigating whether different concentrations of sucrose solutions affect plant cells by osmosis.
In my investigation I have used sucrose as the solute and water as the solvent.
I have used potato cylinders as my plant cells and different concentrations of sucrose solution. I will use five test tubes for the experiment and each contain different concentrations of sucrose solutions:
For a fair test I will leave the potato cores for the same period of time - 24 hours. Before placing the potatoes in solution I shall record the initial measurements. After the preliminary experiment I shall measure and record the change in the potato cylinders’ height, radius and volume. I will repeat the experiment twice using new potato cores, solutions and clean test tubes.
∙ Use a cork borer to extract five potato cylinders from the potato. The diameter being 5mm.
∙ Make sure the potato cores are the same size for accurate results, they are then dried on paper to get rid of excess water. The height is standardized at 50 mm.
∙ Then measure with a ruler and record results for height, radius and the calculated volume of the potato cores before the experiment. Then record the results.
∙ Then place the potato cores in the different concentrations of sucrose solution and distilled water - 0M, 0.25M, 5M, 0.75M 1M. However for the preliminary experiment just only the following three solutions are used - 0M, 0.5M 1.0M.
∙ Place each potato core in the different test tubes for 24 hours.
∙ Record the change in volume, radius and height and recorded the results and worked out the volume change.
∙ Then repeat the experiment twice using new potato cores, in 5 different concentrations of sucrose solutions and use clean test tubes. Leave the potato cores for the same period of time - 24 hours and measure the new results of the height, radius and work out the change of volume.
Apparatus
The equipment necessary for this experiment:
- Five Test Tubes – a test tube for each solution
-
Cork Borer – in order to extract potato cylinders from a potato.
- Ruler -to take measurements of the potato cylinders (before and after).
- Distilled Water – in which one of the potato cylinder is placed.
- Sucrose solution – in which the potato cylinders are placed in
- Scalpel - with which the potatoes are cut to the correct size.
- Potato –from which the potato cylinders are extracted.
- Surface - to carry out the experiment.
- Syringe - with is used to insert solutions into each individual test tube.
10. Labels – label different test tubes to be able to identify each one.
11. Test tube rack – places test tubes in.
Fair Test
To get accurate results it was important I made the experiment fair so I carried out the following steps:
I may only change what I am testing - the concentration of the sucrose solution in each test tube. Hence the investigation involves only one variable factor. I must take some precautions to keep my experiment a fair test. These are:
- Firstly it was important that the potato cylinders (during experiment) were kept at same temperature. If they were placed in different temperatures, it would obviously affect the results and therefore the results would be inaccurate. The temperature must not be too low nor to high so that the cell membrane cannot be damaged.
- Secondly the potato cores should only be from the same potato, if taken from different potatoes the results could once again vary since all potatoes are different. Taking all the cores from one potato would be impossible since there is not a potato big enough. If I did use the same potato throughout the whole of the experiment my results would be more reliable and more accurate.
- The size of the cores has to be the same. This was not difficult as long as I used the same cork borer to retrieve the core from the potato and kept them all the same length. The size had to remain the same because I was also measuring the change in volume. Any indication in size changes could accurately be measured and calculated.
- The ends of the potato cylinders had to have the same surface area, meaning that the ends should at all times remain straight and flat not at a slant. If the end was in a slant, this could lead to more water being able to leave the cell. Leading to inaccurate results.
- The volume of liquid which was present in each one of the test tubes had to be identical since if there was less or more solution in a certain test tubes, this could lead to less or even more osmosis taking place making it an unfair test.
- The only thing that should have been changed in each of the test tubes was the different concentrations of solution.
- When trying to obtain our results, we had to remove the potato cores from their solutions. When doing this, it should be done at the same time. If not, if an individual potato, which is still in its own test tube while another one is being removed from its own test tube, it is immersed for a longer period of time and therefore more osmosis could occur, until equilibrium this leads to unfair results
∙ The time for each experiment had to be the same for a fair set of accurate results.
- All initial measurements before beginning the experiment should be accurately taken and should be the same in all of the potato cylinders. After the experiment is completed any change in the measurements should be also noted accurately.
- During this experiment I made sure I got satisfactory results. I made sure it was an accurate test and the most accurate results obtained by carrying out the experiment 3 times - preliminary experiment, first experiment and second experiment.
Safety
Safety was necessary in the experiment and I had to take a great deal of care. To ensure this, I did the experiment while standing incase of any spillages that would occur. Using a cork borer and scalpel I had to take a great deal of care, as they both are very sharp items and could be harmful to those around me especially if I used them incorrectly. When using these two pieces of equipment I was very careful to make sure I did not cut any fellow pupils or myself. I was also aware when handling the glass test tubes, in - case any spillages.
Measuring The Potato Cells
To measure the change in volume I used the formula π r 2 h. Before carrying out the experiment I measured the height, radius and volume. Then placed the potato cylinders in different concentrations of sucrose solution to explain how osmosis has occurred.
After 24 hours I again measured the potato cylinders and calculated the worked out the change in volume using the formula π r 2 h and then worked out the percentage change in volume.
Different Range Of Solutions
The solutions of sucrose solution varied each time - 0M, 0.25M, 0.5M, 0.75M and 1M. From the ranges of sucrose solutions we could see how the rate of osmosis was affected in the different concentrations of sucrose solution and how it affected the plant cells (potato cylinders).
Results
The different experiments that we did:
Preliminary Experiment
I kept the preliminary experiment fairly simple and used three different concentrations - 0M, 0.5M, and 1.0M.
To make the experiment fair I left the plant cells in the different concentrations of sucrose solution for the same amount of time - 24 hours. After this I then re-measured the new values and calculated the change in volume and then worked out the percentage change in volume.
These initial measurements above were the same in the next two-repeated experiment’s results on the following page.
Final experiments
The final experiments were more detailed than the preliminary experiment because I was able to gain more accurate results and 5 solutions were used to obtain more accurate results. I was able to repeat the experiments, which helped to see if the experiment was totally correct, and if my results agreed with my prediction. If the results from just one table were totally incorrect I could have made a conclusion using two sets of results. If there were more problems and all three were different, I would then have to repeat the experiment again.
First Experiment
Second Experiment
I made an average of % change out of the two and experiments but not including the preliminary experiment:
There are no anomalous results and these results agree my prediction as the concentration of sucrose solution increases, the volume of the potato cylinders decrease since water moves out of the cell, down the water potential gradient by osmosis.
Conclusion
From my results of the completed experiment I can observe in detail the affects on the potato cylinders, when varying the concentration of the solution in which they are placed – 0M, 0.25M, 0.5M, 0.75M, 1.0M.
The results agreed with my prediction that more concentration of sucrose solution, a decrease in volume. There were no anomalous results in my epxermiment.
The results from my preliminary results agreed with my prediction that as the concentration of sucrose solution increases, the volume of potato cylinders decrease. In water a hypotonic solution the potato increased in volume dude to endosmosis. The cell becomes turgid: the 0.5 solution was not isotonic, hence there is relatively little chance in the cells volume. The 1 molar solution is hypertonic so water moves out of cell by exosmosis, the cell shrinks, and its volume decreases. There were no anomalous results
In my final sets of results, I also used a 0.25M and 0.75M solution.
In the first set my results showed a similar pattern to my preliminary results and agreed with my prediction. As the sucrose concentration increased the volume of the potato cell decreased. 0M and 0.25M solutions were hypotonic, water entered the cells so the potato gained in its % volume. The 0.5M solution was isotonic, hence there was relatively little change in the volume. Finally the 0.75M and 1.0M solution was hypertonic, the cells volume decreased due to exosmosis.
The second set of results followed the same pattern, as the first set and there were no anomalous results like the first set. It can be concluded that 0M and 0.25M solutions were hypotonic, water passes into the potato cells, by osmosis down the concentration gradient. The cells increase in tugor and volume. The 0.5M solution is isotonic, there is little change in volume. The 0.75M and 1M were hypotonic, water passes out of the cell, down the gradient, the cell shrinks and its volume decreases.
My results that I obtained all agreed with my prediction and received no anomalous results. I had predicted that as the sucrose solutions increase; the volume of the potato cylinders decrease this has been show by my results.
I think it can be concluded that my results support my prediction, and it can be said that I carried out my investigation successfully. However, there are minor problems that could be improved. I will discuss them in my following evaluation.
Graphs
The preliminary graph showed as the concentration increases the volume of the potato cylinders decreases, which clearly supports my prediction. The line is of best fit and is non – linear steady curve, the line slowly decreases and goes down and slowly rounds of. The graph shows there were no anomalous results.
The first graph showed as the concentration increases the volume of the potato cylinders decreases, which clearly supports my prediction. The line is of best fit and is non – linear steady curve, the line slowly decreases and goes down and slowly rounds of. The graph shows there were no anomalous results.
The second graph showed as the concentration increases the volume of the potato cylinders decreases, which clearly supports my prediction. The line is of best fit and is non – linear steady curve, the line slowly decreases and goes down and slowly rounds of. The graph shows there were no anomalous results.
Evaluation
The results I received were satisfactory and all supported my prediction that as concentration of sucrose solution increases, the volume of potato decreases – this is plasmolysis and when the potato cylinders are placed in distilled water they increase in size –to form a turgid state. In an isotonic solution, there is little change. I feel I obtained satisfactory results I think if there was more time I could have investigated additional factors to broaden my investigation and perhaps even have more accurate results
For example:
∙ Environmental problems. Gases and dust particles could have got mixed up with the different sucrose solution, which could have had some affect on the experiment and therefore slightly inaccurate results. If it was possible a lid or sometime of seal protector could have been used.
∙ The solutions could have been slightly inaccurate i.e. there was not exactly same amount of sucrose solution in each test tube.
∙ When cutting the potato cylinders out with a cork borer they could have been slightly different in shape or size if I made an error despite standardizing which could have led to slightly inaccurate results.
∙ Instead of simply observing the differences after 24 hours, I could have noted any changes every few hours. This would allow me to study in more detail - the rate of osmosis, as well as the affect of varying the concentration of the surrounding solution.
∙ If there was more time I would repeat the experiment for even more for much more accurate results.
∙ I could also try an experiment replacing the potato with another sort of vegetable like a beetroot to see how osmosis affects other things.
∙ I could have seen the different affects of temperature on osmosis and the affects of humidity.
∙ If more time was given I could have changed the variable which was sucrose solution to a different variable e.g. temperature.
If there was more time I would have taken more with these factors and if it was possible.
∙ Experiment could of taken out in a fume cupboard, which would have lead to more accurate results
I tried to carry out a fair test, to the best of my ability and keep all the controls the same for a fair test. However often it was difficult to control certain factors e.g. temperature under which the experiment took place and how light or dark it was.
To broaden my investigation and improve other factors, which could lead to accurate results, would give me additional and more accurate evidence towards my conclusion.