After 15 minutes I will take all of the potato chips out and once again weigh each one individually comparing its original weight to its resulting weight
Apparatus
I will be using the following equipment in my investigation:
- Specialised potato cutter
- Cutting tile
- Knife
- Petri dishes
- Beakers
- Measuring cylinders
- Stirring rod
- Pipettes
- Digital scales
- Potatoes
- Water
- Sucrose
Variables that could affect the outcome
To ensure that my investigation is fair there are certain variables that I plan to keep constant throughout. These include:
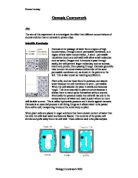
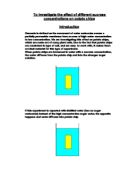
Surface area of potato chip – The larger the surface area, the more water can be absorbed. Therefore to make it fair I shall use the same size cylindrical cutter on all of the potato chips and cut them to the exact same length.
Solution volume – To control this factor I will carefully measure the amount of sucrose solution and keep it exactly the same for each individual experiment.
Type of potato – This could be affected by using two different types of potato in the same investigation. This could and inevitably will contain different concentrations of water affecting the rate of osmosis. To control this I will ensure I do the experiment using the same potato.
Temperature – This factor is not easily controlled. I will be carrying out the investigation at room temperature, so if I complete it on the same day, the temperature could not change so drastically that it would affect my investigation.
Length of experiment – I will ensure that I keep this the same by submerging and removing the potato chips at the same time.
Weighing scales – I will ensure that the scales are always reset before placing each potato chip on the balance. This will make it fair and clear any previous weighing.
The variable that I plan to change is the concentration of the sucrose solution. I am going to do five variations on the solution. These include 0M (molar) 0.25M, 0.5M, 0.75M and 1M. The range is substantial enough to allow me to put my results into a graph and identify whether or not there is a definite correlation
Safety
Dangers that might be encountered during this experiment or affect the outcome include:
Sharp Knives – Knives and potato cutters have sharp edges, so when cutting the potato, I shall take great care not to cut myself.
Spillages – As we are using two types of liquid in this investigation it is more than likely that some of it will get spilled. If this does occur I will be sure to clean it up immediately so as nobody can slip on it and hurt themselves.
Breakages – The petri dishes that we are using are made of glass. If they smashed, the sharp edges of the glass could cause harm or cut people. If this does happen, I will take great care in cleaning it up as quickly and safely as possible.
Prediction
I predict that the lower the concentration of sucrose, the more osmosis will take place. I say this because if there is a high concentration of water in the surrounding solution, then it is likely to be more than that in the potato. If the solution surrounding the potato has a higher concentration than that in the potato osmosis will occur, with water moving from the solution into the potato causing it to gain weight. If the water concentration in the potato is higher than that in the surrounding solution, water from the potato will move into the solution. This will cause the potato to lose weight. I therefor predict that as the concentration of the sucrose solution increases the amount of weight that the potato gains will decrease. However, I predict that the rate of osmosis will not change, due to the fact that I will not be changing any other variables such as temperature that could speed up the reaction.
Results
To work out the percentage change I used the formula
PC = Difference
Mass before
This will help me to put all of the three of the experiments into perspective and give them all a relative number. This will then allow me to calculate an average to get the most reliable result. So here is a table with the average percentage change for each concentration.
I will now put this information into a graph to give me a better indication of any correlation that has emerged
Analysing and considering evidence
The graphs on the previous pages show simply that as the concentration of sucrose in the solution surrounding the potato increases the mass of the potato chip decreases.
The fourth graph drawn was that of average percentage change across three experiments. This will give the best indication of any correlation, identifiable trends and anomalous results. After the results were plotted, an almost straight line was produced, however it did curve slightly. The gradient of the line was steeper at the top than at the bottom of the graph, showing that as the concentration (M) of the solution increases the rate which osmosis takes place decreases.
The other three graphs (one for each individual experiment) show how the mass of the potato chip changed. By using a bar chart we could see how much the potato chip’s mass increased and easily identify trends or anomalous results.
The second experiment for example, has a very obvious result that is not correct. The reading for 0.75 M clearly does not follow the same pattern as in other experiments. For 0 – 0.5M the percentage change in the mass of the potato chip had gradually been decreasing, however at 0.75M it suddenly starts to rise. Inspite of this, the reading for the 1M solution is as if the reading for 0.75M had decreased as expected. This makes the difference between the two readings even larger.
The bar chart for the second experiment also shows something that neither of the other graphs do. It shows how the osmosis that took place reached equilibrium. This is when the concentration of water molecules on either side of the semi-permeable membrane (the petri dish and inside the potato) is equal. This must mean, that before and after this point, the mass of the potato must be changing.
The mass of the potato before the equilibrium is reached increases. This is because the concentration of water in the potato is less that that in the solution surrounding it, and as in osmosis water molecules move from a high region of concentration to a low region of concentration, the water molecules from the solution move across the semi-permeable membrane and into the potato. This causes the potato to gain weight.
The mass of the potato after the equilibrium is reached decreases. This is because the concentration of water in the potato is higher than that in the solution surrounding it, therefor the water molecules will move from the potato into the solution causing the potato chip to lose weight.
The evidence sufficiently supports my prediction. Although several anomalies were detected, a solid foundation of results was produced, leading to a very positive conclusion. I predicted that as the concentration of the sucrose solution increased, that the amount of weight that the potato gained would decrease. This was correct, however part of my prediction was wrong. I expected no change in rate of reaction, the graph showing percentage change indicated that this in fact is not true and the rate that osmosis takes place starts to decrease as the concentration of the sucrose solution increases.
Evaluation
The procedure carried out to investigate how the concentration of a solution affects osmosis in potato chips was fairly secure and reliable. It was safe, and used the best equipment the school could offer to ensure that the best results possible were obtained. Nothing disastrous occurred, no injuries and no complete abandoning of the experiments because they had gone so far off track.
Anomalies identified earlier show that there must have been errors made during the experiment. This could have been due to many variables that were not under control, such as temperature, however I think it very unlike that this variable would affect the experiment in such a way. I feel it more likely that someone may have weighed the potato chip incorrectly, may have left it in the solution for too long or calculated the difference in mass wrongly. The most probable explanation for this anomalous result is that the solution was not made in the correct ratio, or very accurately. All of the above are human errors and can only be controlled by concentrating hard on the investigation and completing it to the best of your ability. Human errors are the only factor or variable that is uncontrollable as humans do not know when they make mistakes until after it has been made, otherwise they would not make them in the first place! Other errors such as transcription errors (errors made whilst recording the data) such as copying the wrong thing from the scales could also explain this.
During this investigation we used measuring cylinders to work out the amount of sucrose solution needed. This may indeed have not been very accurate at all. When measuring with a cylinder, you should always put the tube down on a horizontal surface before taking a reading, otherwise the water could tilt producing a false measurement. This may have been done several times during this investigation. To increase the accuracy we could have used large pipettes that are far more precise and leave a smaller margin for error.
Other changes that could have been made to the procedure, increasing the accuracy and quality of results produced, include:
- Making sure that the same person measured and calculated the different solutions would ensure that they were all done in the same way. As this was not what occurred in the actual investigation we are not sure how many different ways the solutions were made, however we know that they were not consistent.
- Using the same size petri dish for each experiment would have meant results fabricated would have been more alike and therefore more reliable. Different petri dishes provide different depths. With the same amount of solution in each one, this would have lead to some potato chips being submerged more than others, possibly affecting the amount of osmosis that occurred.
- If the experiments had all been carried out on the same day, temperature could not have affected this experiment in any dominant way. However, the three individual experiments were carried out over a period of one week, running a risk of completely different temperatures and climates to work in.
Additional experiments could be undertaken to investigate other possible factors affecting the amount of osmosis taking place in a potato chip.
The first is that we could establish if temperature affects the amount of osmosis that takes place. I would do this by having two different concentrations of sucrose solution (such as 0M and 1M). Two potato chips would be submerged in 0M and 1M solutions at room temperature and two would be placed in heated solutions. After leaving them for a specified amount of time I would compare the weight after from the weight before. This would tell me whether the rate of osmosis can be changed by temperature and would also help me in the current investigation. I predict that in this investigation the temperature increasing would cause the rate of osmosis to increase. If the solution is heated, particles will be moving faster and reaching the semi-permeable membrane with more speed.
The second experiment that could be undertaken is to investigate how different types of potato affect the rate at which osmosis occurs. No two types of potato will hold the same concentration of water molecules. If I were to investigate this I would use the same concentration of sucrose solution and five different types of potato, possibly with different origins. I would then leave the chips in the solution for a suitable amount of time before comparing the weight before and after.
This further investigating may help to support my conclusion in this current investigation and may also help to explain the anomalies.