Preliminary results
I discovered that the potato in distilled water had increased in mass and the one in sucrose had decreased in mass. This decrease was due to the flow of water out of the vacuole making the vacuole pull inwards, away from the cell wall meaning the cell was plasmolysed (flaccid). Thus the increase was due to the flow of water into the vacuole and the vacuole had begun to push against the cell wall, this is known as a turgid cell. Turgor pressure is caused by the uptake of water by the cytoplasm of the cells so that pressure is exerted at the plasma membrane on the cell wall.
I therefore predict that the potato cores in distilled water will increase in mass because the water molecules will diffuse from the solution into the sap vacuoles of the cells in the core. The water molecules will diffuse across the semi-permeable membrane, because the sucrose concentration is higher in the sap vacuole than in the distilled water. Water molecules enter the sap vacuole of the cell due to osmosis, and make the cell turgid. This means on my graph as the concentration increases on the x-axis the change of mass will decrease.
I also predict that the isotonic point will be around 3 molar because it is a weak sucrose solution and in my preliminary work I found out that the isotonic point was in a weak solution; so I am hoping it runs onto my investigation; the maximum size I predict my isotonic point being is 5.5 molar because it is the average of all my different concentrations.
The reason why I have predicted this is because the isotonic cellular environment occurs when an equal solute concentration exists inside and outside the cell. Molecules flow in and out at an equal rate by osmosis, causing the cell size to stay the same. It will not lose or gain any solutes.
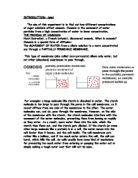
This diagram shows us the turgid cell and the plasmolysed in comparison to a normal cell.
Method:
- I took an average sized ground potato and checked that it was both healthy and hard.
- Using a table knife I cut pieces of potatoes out into chips exactly 2cm in length each. In total I had 8 chips.
-
I took a boiling tube rack instead of a test tube rack because they are too small for the chips and placed 4 boiling tubes in and labelled them, 0: distilled, 0.4: weak sugar solution, 0.8: strong solution and 1: sucrose. This will be done by adding varying amounts of distilled water to varying amounts of sucrose solution with a pipette in order to make sure my accuracy was perfect. (See Fig. 1)
-
I then weighed every potato chip on an electronic scale and recorded the weights.
- Next I put the potatoes into every boiling tube and left them. I used two chips in two different boiling tubes with the same concentration in order for me to get an average for each concentration and a better result for my graph.
- Whilst waiting I drew a table ready to record the results. I also prepared some paper tissues.
- After 2hours and 20 minutes I drained out the solutions in the sink and placed the potatoes on the paper tissues.
- I then dried the potatoes with the paper tissues.
- Next using the electronic scale I measured the potatoes accurately.
- Each weight was recorded into my table.
- I made sure I made numerous readings for each solution to obtain an average in the mass change.
Fig. 1
I chose these certain concentrations because I wanted there to be a distance between the concentrations in order to get a wider set of results and a smother curve on my graph. If I chose concentrations that were close together I would not be able to see much difference between the concentrations and it would affect the graph because it would not be clear to see changes between concentrations. So in other words doing so makes my results more reliable because of the wide range.
Precautions: During this investigation the measurements for the solutions had to be precise as to not change the outcome of the experiment. I had to ensure that I took care cutting the potatoes because I could have easily cut myself by accident. I also had to ensure that every time I handled the potatoes my hands were clean and dry. This was to stop any kind of contamination and made sure that I did not pass on any extra water onto the potato which would alter the tables of results for all concentrations.
How I kept it a fair test? : To create a fair test certain aspects of the experiment will have to be kept the same whilst one key variable is changed. I have chosen to vary the concentration of the sugar solution. This will give me a varied set of results from which I hope to make a decent conclusion. If any of the non-variables below are not kept constant it would mean it would not be a fair test. For instance if one of the potato chips was 1cm longer the surface area of the chip would be larger and there would therefore be more space for osmosis to occur. Doing all the tests at one temperature will control the temperature. I included a wide range of concentrations to get a broader result.
.For the purpose of my experiment I am going to do all the experiments at room temperature to keep the results fair.
.To keep the water potential of the potato initially will be kept the same by using the same type of potato, which has been treated in the same way.
.The mass of the potato is a dependent variable, and this means that it will be measured.
.Throughout the experiment I will measure the mass in grams. The potato chip will be measured before it is put in the solution, and after. This will allow us to see whether osmosis has taken place, and to what extent.
.The volume of the solution that the potato chips are kept in must be fair. The must be totally covered in the solution, and the amount of solution will be kept the same because all the potato chips are the same size.
.I am also going to use the same balance to weigh my potato chips. This is because the measurements may slightly vary between scales.
Here are different variables that would be taking into consideration.
.Solution concentration
.Solution volume
.Duration of experiment
.Temperature
.Solution
.Weighing scales
.Conditions
.Preliminary Results
During the investigation I decided to repeat the experiment for one certain concentration because it did not relate to any of my other results. This result would have damaged the graph and the investigation.
Results: See Graph and table.
Conclusion: To conclude the investigation, I can say that the movement of water through a semi permeable membrane is affected by concentration of the sucrose solution.
Therefore, the chips in lower water concentrations will have a larger mass than in higher sugar concentrations which would decrease in mass; this is due to osmosis in the cells. I can also safely say that the isotonic point is between 3 molar and 5.5 molar because on my graph the isotonic point is at 3.5 molar this corresponds positively to my prediction.
When this is shown on a line graph, we find that there is a correlation between the results, supporting the conclusion that the stronger the concentration of the solution outside the cell, the faster plasmolysis occurs. There is a pattern on my graph, and this is, as the concentration of the solution increases, the change in mass decreases.
I believe my results are very accurate because I took a lot of care and consideration in my measurements and made sure they were very precise. Therefore I think my prediction is correct because it corresponds with my results. From the line of best fit that has been added on my graph, it can be seen that all of my points were very close to creating a perfectly smooth curve. This shows that my results are fairly reliable.
The gradient changes in my graph. It gets less steep as the sugar solution increases. This is because the potato chip is becoming flaccid meaning the cell has lost its firmness, and so the change in mass of each concentration is becoming closer and closer together.
My results follow my prediction to some extent because I was right in saying that as the concentration increases on the x-axis the change of mass will decrease on the y-axis. This also shows that my results are reliable because they are very similar to my preliminary work and my prediction.
Evaluation: I think that this investigation went well and worked well. And I believe the results were very accurate. I had a few unexpected results in my preliminary work but since then I have learnt the mistakes that I made e.g. making measurements of concentrations more accurate.
However there was an anomalous result in this investigation under 0.4 molar, I think their should have been no change in mass instead of a negative change in mass because in my preliminary work 0.4 molar had no change in mass, but because several readings of the concentration were taken, these anomalous results did not disrupt the overall graph or the conclusion.
The anomalous result was probably caused by a difference in the surface area of the core which was due to imprecision during the cutting procedure. If this experiment was repeated, or a similar one undertaken, greater accuracy during cutting could probably prevent any anomalous readings occurring.
This investigation overall was very reliable because all of the control variables were taken into deep consideration; however I found it very hard to control the temperature because the temperature at the time was slightly unsteady. This may have affected the results and the conclusion to a slight extent. On the other hand the results were accurate because there was a positive correlation between the investigation and my preliminary results although there was one anomalous result which as I have said didn’t affect the investigation that much. So I believe that the reliability of my investigation is sufficient to back up my conclusion.
I have several proposals for further experiments to provide additional evidence for my conclusion. I would like to undertake another experiment with sucrose concentrations at 0.05 intervals from 0 to 1. I would like to do this as I feel it would provide a better and more reliable set of results and a more justified conclusion. When there are more concentrations the shape of the curve shape can be seen more clearly, I suspect that at the lower concentrations of sucrose the graph falls more steeply, flattening off at higher concentrations. I would also like to conduct an investigation, in conjunction with this experiment, to calculate the concentration of sap within the vacuole.
To do this, I would find between which parameters the curve crosses the x-axis of sucrose concentration and retest at every 1% between these two parameters until I have found the concentration which contains a core that neither gains nor loses mass. This osmotic concentration would be the equivalent of the sap in the vacuole (isotonic point).
As an extension to this investigation, I would run two experiments in parallel. All cores would be from the same potato, but one would run for an hour, as this one did and for the other the cores would be left in the solutions for longer, perhaps 24 hours, to establish if one hour is the end point of the osmotic diffusion.
Bibliography:
- Britannica 2002
- Collins dictionary
- Exercise book
- Biology text book
- Encarta 2005