- How many results will be taken
- The range of variables to be tested
Safety
With this straightforward experiment there is not much that needs to be taken into consideration in terms of safety. No harmful substances are being used, neither are flames, or solvents, so this is a relatively safe experiment. At the bottom of the tube some sort of barrier will need to be placed to prevent damage to the ball bearing as it emerges from the tube, or to prevent it getting lost.
Fair Testing
As with all scientific experiments, only one variable must be altered at one time, to allow accurate interpretation of the change. All the rest must remain constant to ensure good sensible results. By using present knowledge, it is know that the following factors can affect the outcome and must be controlled:
- Height of tube – as this is included in the formula for potential energy, the height of the tube should affect the speed of the ball bearing in some way. This variable will be modulated in the experiment.
- Mass of ball bearing – mass is also included in the formula for potential energy and so could affect the speed of the ball bearing. It should be constrained by simply always using the same ball bearing to collect each result. The mass of the ball bearing used in this experiment was 16.8g.
- Gravity – the last portion of the formula for potential energy is gravity, which will affect the outcome if it is increased or decreased. This will remain constant, as the experiment is held in a single location.
- Friction – I mentioned that the only factors that should affect the outcome of the experiment would be mass, height and gravity - because they make up the formula for the potential energy. But other factors may use some of this energy when it is being converted into kinetic (movement) energy as the ball bearing moves down the tube. The friction between the ball bearing and the surface of the tube can ‘steal’ some of the energy used to move the ball bearing and convert it to heat instead. This can slow down the ball bearing, but only very slightly. To maintain the same friction for all the results, the same material for the surface of the tube should be used, along with the same material for the ball bearing.
- Air resistance – there is very little which can be done to control this factor, and its effects would be so insignificant it may not matter. Basically, the same ball bearing must be used each time.
With these points in mind it is essential that the same ball bearing, the same tube and a constant mass must be used in the experiment. The length of the tube must also be kept the same, so the ball bearing has enough time, and the same amount of time, to accelerate.
Ranges and amounts
To make this investigation successful, a sensible range, and amount of readings to record in order to come up with a useful and informative outcome must be chosen. For example, in this experiment it would be pointless to experiment with heights ranging from 1cm-2cm because the speed difference would be minor. Instead a more sensible range, say from 10cm-30cm, would be appropriate and should yield some significant results. Readings could be taken every 5cm, and take a minimum of ten readings on each height to work out an average (this makes the end result more accurate).
Equipment
Before beginning, a list of equipment for the experiment will be needed to ensure it all runs smoothly:
Ball bearing – To roll down the tube
Tube – For the ball bearing to roll down
Metre Stick – To measure the tube
Stop Watch – To time the ball bearing
Barrier (box) – To stop the ball bearing flying off the table
Clamp stand – To hold the tube in place and allow us to increase its height
Data Collection Sheet – To record results on
Stationary – To write results down with
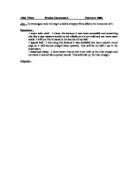
Below is a diagram of how the equipment will be set up and used.
Using this equipment, results can be easily obtained with a high degree of accuracy. The usage of the clamp stand means it is possible to increase the height by any amount. Perhaps manually timing the ball bearing with a stopwatch is not the most accurate way of recording the time taken, but a better alternative may be found when the experiment is done.
Why?
From this experiment it will be possible to find out what factors affect the speed of a body when no manual force is applied to them (i.e. pushing them). This experiment is being conducted to prove the potential and kinetic energy formulae, which, once completed, can be used to calculate exactly the results of any situation using these theories.
Method
A step-by-step guide for the experiment has been produced to ensure that when practical work is conducted, it runs flawlessly. This should ensure that the test is conducted fairly, following the same set of steps each time results are collected.
Primary Experiment
- Set out equipment as shown in the diagram
- Ensure the height at the summit of the tube is 10cm using the metre rule
- Hold the ball bearing with its front touching the summit of the tube
- Simultaneously start the stop clock and release the ball bearing (be careful not to push it or exert any extra force on it)
- Stop the clock when the front of the ball bearing reaches the finish line
- Record the time taken for the ball bearing to reach the finish, next to the relevant height, in a table
- Repeat from step 4 nine more times so the end result is ten results for the same height
- Add all these results together and divide the answer by ten to obtain the average (mean) result.
- Record this average in the table
- By moving the clamp up the clamp stand, increase the height at the summit by 5cm. Use the metre rule to check
- Repeat from step 4 until results for heights from 10cm through to 30cm have been obtained
By following these guidelines exactly, and not doing anything extra, a very fair test can be conducted.
Predictions
As mentioned in the Introduction, the experiment is based on the potential energy at the top of the tube being converted into kinetic energy at the bottom. It is possible to say:
Potential Energy (at the top) = Kinetic Energy (at the bottom)
This is not totally true – some energy may be lost as heat from friction, but this amount is so minimal, that the above statement could be considered to be true, which it will for the rest of this investigation.
It is also known that the following formula can be used to calculate potential and kinetic energy:
Potential energy = work done
= weight x height lifted
But on Earth, weight (in N) = mass x 10 so:
Gravitational P.E = Mass x g x height (or, mgh)
(joules) (kg) (N/kg) (m)
(g has a different value on other planets, but on Earth it is equal to 10)
The formula for kinetic energy is:
K.E = ½ x mass x velocity squared
K.E = ½mv2
Knowing this it is possible to write:
P.E = K.E
mgh = ½mv2
This formula will give the average velocity for the ball bearing going down a tube of h metres high. Once this has been found, it is possible to use the equation for average speed to calculate how long it will take the ball bearing to reach the bottom of the tube and actually produce a theoretical result prior to conducting the experiment. This won’t be necessary for a simple prediction, but it shows that the higher the tube is raised, the higher the velocity of the ball bearing will be resulting in a quicker time to reach the finish line. From this formula it is possible to predict the shape of the graph v against h. As h increases, for example by 5cm each time, v will increase too – but not in proportion. This is due to the square root in the formula that we have to use to find v. The higher the height goes, the flatter the line becomes. The graph will look something like the following sketch.
Therefore, it can be predicted that:
An increase in the height of the tube leads to an increase in the velocity of the ball bearing
Results
This section is mainly putting the planning into action, and hence is nearly all practical work so not much written work will be produced.
As can be seen, ALL results were repeated ten times, to improve the accuracy of the experiment.
Then the speed, K.E and G.P.E for each average time were calculated.
Analysis and conclusions
The graph clearly shows the increase in speed as the height of the tube greatens, but not in a proportional manner. The slight curve suggests that another force is acting on the ball bearing and not permitting it to increase speed uniformly.
Conclusion
The prediction was proved correct as the graphs clearly show that the speed does indeed increase when the tube is raised higher. This is due to the fact that more potential energy is given to the ball bearing as it is raised higher – height is part of the formula that makes up P.E:
P.E = mgh
P.E = mass x gravity x height
So the higher an object goes, the more gravitational potential energy it gains. When it falls, its potential energy is converted into kinetic energy and; since energy can neither be created or destroyed, only converted; it will move at a faster speed.
So, to sum up, as an object is lifted to a height, the chemical energy stored in the person lifting the object (which comes from the food which is eaten) is converted into gravitational potential energy. Obviously, the higher the object is lifted, the more energy the lifter is using and therefore the more potential energy the object is gaining. Potential energy is converted into kinetic energy almost completely so the object when released will move at a faster rate depending on how high it is lifted.
Height does affect the speed at which a ball bearing travels down a tube
Evaluation
The experiments went very well and ran efficiently, primarily due to the plan, which had been drawn out beforehand. For this experiment, the results couldn’t be as accurate as the system allowed, so the results were rounded to two decimal places. Unfortunately, for this the experiment the time the ball bearing took to travel down the tube was manually taken using a stopwatch. Due to human error and reaction time, these results could not be relied on completely, but were an accurate estimation. If this experiment were to be conducted again, the results could be made more accurate by producing them using a computer system with light gate, to electronically time the ball bearing.
However, after saying this, there were no major anomalous results taken, which is likely due to the preliminary testing in which the method was perfected. Although there were no major anomalies, there were some slightly anomalous readings, although they were too small to disrupt the averages. Some of these anomalous times (the two 1.70secs reading on the height of 10cm for example), may have been human error; the timer was not watching very closely, or the path of the ball bearing may not have been as straight as the others, and therefore the ball bearing had slightly further to travel. So, overall the reliability of the evidence to very good; any anomalies were very small.
However, a sensible amount of results had been collected, which gave enough information to draw a firm conclusion from. If this experiment were to be conducted again, the amounts would not be changed because with these amounts, it was possible to achieve maximum outcome in the time allotted.
If this experiment were to be repeated, it could be focused on different materials for the tube. This would allow friction and its properties to be investigated, which may help with this investigation, as it would give an indication of how much friction affected the results. It would also help to find a way to make sure that the ball bearing travelled in a straight line each time the investigation was performed, as this may have caused some small anomalies in the results, due to the fact that the ball bearing didn’t always travel exactly the same distance.