This led to Ohm’s law:
‘The voltage across a metal conductor is proportional to the current through it, provided that the temperature stays constant’.
Ohm’s results show that doubling the voltage doubles the current. The larger the resistance the greater the voltage needed to push each ampere of current through it. This means that the voltage is proportional to the current. This led to a definition of one ohm:
‘A resistor has a resistance of 1 Ω, if a voltage of 1 V will drive a current of 1A through it’.
The resistance of a resistor is the voltage per unit of current.
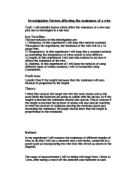
However, thermistors do not obey the Ohm’s law. This is because their temperature starts to increase at a certain temperature. So, a material may or may not obey the Ohm’s law. Below shows my secondary source of information from ‘GCSE Key Stage 4 Longman Study Guides Physics’ of a typical thermistor graph. As we can see it is a curved graph. It shows the resistance increasing then decreasing rapidly or coming to a halt. This change in resistance is due to the temperature increase.
A graph of a thermistor
Ohm’s law applies to all electric circuits for both direct current (DC) and alternating current (AC), but other principals must be raised for the analysis of complex circuits and for AC circuits also involving inductances and capacitances.
The resistance of an object is determined by the nature of the substance of which it is composed, known as the resistivity. Resistivity is expressed in terms of the ohms resistance per cubic centimetre of the substance at 20°C (68°F).
As the current flows, it comes upon a certain amount of resistance from the conductor and any resistors in the circuit. Each material has a characteristic resistance. For example, wood is a bad conductor because it offers high resistance to the current; copper is a better conductor because it offers less resistance. Resistors are often made to have a specific value of resistance so that the characteristics of the circuit can be accurately calculated.
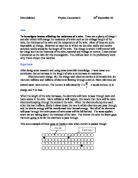
We can explain the flow of current through a resistor by comparing it to water flowing through a pipe. A pressure difference maintained across two ends of the pipe by a pump is like the potential difference, or voltage, across a wire maintained by a battery. The rate of flow of water, analogous to the rate of current, depends on the type of pipe used. A long and thin pipe offers more resistance than a short and thick one or a pipe that has obstructions. Similarly, the resistance of a wire is dependent upon several factors, including its length, cross-sectional area, temperature, type of material (resistivity). Resistivity is a fundamental characteristic of the material itself defined by the voltage divided by the density of current (current per unit cross-sectional area) flowing across the material.
A material of high resistivity will require a higher electrical field to cause a given current density. If the resistivity of a material is known, as well as its dimensions, it can be used to calculate the resistance of a particular piece of material. The resistivity of a material is also dependant upon temperature. When a material resists the flow of current, it converts the electrical energy into other kinds of energy such as heat and light. This energy causes resistors to heat up and glow when enough current flows through them.
Resistors are designed to have a specific value of resistance. Most resistors used in electric circuits are cylindrical items a few millimetres long with wires at both ends to connect them to the circuit. Resistors are often colour coded by three or four colour bands that indicate the specific value of resistance. Some resistors obey the Ohm’s law, which states that the current density is directly proportional to the electrical field when the temperature is constant. The resistance of a material that follows Ohm’s law is constant, or independent of voltage or current, and the relationship between current and voltage is linear. In diodes, the current does not increase linearly with voltage and is different for two directions of current.
Variable resistors are used in electronics (and are then called potentiometers) as volume and other controls. Larger current versions are useful in laboratory experiments. Constantan wire is an alloy of 60% of copper and 40% of nickel. In the laboratory the constantan wire is wound on a tube with a sliding contact on a metal bar above the tube. The variable resistor can also act as a potential divider for changing the p.d. applied to a device, all three connections being used. So, it can be used also as a rheostat.
From my background information I can now predict that the thinner and longer the wire the high resistance and lower the current. The thicker and shorter the wire the lower the resistance and higher the current. The results in turn should produce a straight-line graph.
Fair Testing
To ensure that my experiment is carried out fairly I should do the following:
- I should not keep all the variables changing at one time.
- I should keep one variable constant and the other varying each time. E.g. When varying the length I should keep everything else the same apart from the length of the wire itself. When varying the thickness everything else should be the same apart from the thickness of the wire itself.
- When cutting the length of the wire I should make sure that it is exactly the same length; not any more and not any less, as this would affect my results.
- I should have a good range of readings. The more readings I have the more accurate the answer will be.
- After one reading I should disconnect the whole circuit and then connect it again instead of just turning the power off. This will also help in giving me more accurate answers.
- I should keep the voltage at 4 volts the maximum at all times, as above this voltage the wire will burn.
- I should not give priorities to one variable only.
Preliminary work
I have done only one previous experiment of which I did wrong. I kept varying the resistance on the rheostat for each reading I made. This was incorrect, as the resistance should have been kept the same. I also turned the power off instead of disconnecting the circuit, which I was not supposed to do. However, everything else turned out right.
In my preliminary work I did the above. Therefore, I am not going to do these mistakes. I will not vary the resistance at all. Neither will I turn the power off. I will disconnect the circuit. I will also take three readings each time.
Safety Procedures
- Handle all substances with care.
- When you increase the resistance decrease the voltage.
- Do not set the voltage on the power pack over 4V, as this will burn the wire. Do not keep the resistance very low, as this can also burn the wire and is dangerous.
- Keeping the resistance low can also result in the apparatus being damaged.
- Remove loose clothing and make sure the wires are secure and do not touch them.
- You should not eat during any part of the experiment and keep water well away from the apparatus.
- You should not leave experiment unattended.
- To prevent electrocution ensure that your hands are dry during all parts of the experiment.
- Do not run around in the laboratory and keep all bags underneath tables, as people can trip over them.
Variables
(Varying length)
(Varying thickness)
Apparatus
- Power pack
- Connecting wires
- Variable resistor – rheostat
- Types of material – constantan and nickel chrome
- Ammeter
- Ruler
- Clip
The following shows a diagram of how the apparatus will be connected:
Method
Varying length
Step 1: Set the power pack to 4V.
Step 2: Connect a wire from the power pack to the rheostat.
Step 3: Connect another wire from the rheostat to the
Step 4: Connect a wire from the clip to the ammeter.
Step 5: Connect another wire from the ammeter back to the power pack.
Step 6: Cut a piece of wire at 10 cm using a ruler and put it in the
Step 7: Make sure all the apparatus is connected properly and the resistance
is not very low.
Step 8: Turn the power pack on and take a reading.
Step 9: Disconnect the circuit and connect it again and take another reading.
Step 10: Repeat step 9 again.
Step 11: Repeat steps 1-10 again for a piece of wire at 20 cm. Keep
increasing the length by 10 cm each time.
Only keep the length varying. All the other variables should be kept constant.
Varying thickness
Step 1: Set the power pack to 4V.
Step 2: Connect a wire from the power pack to the rheostat.
Step 3: Connect another wire from the rheostat to the
Step 4: Connect a wire from the clip to the ammeter.
Step 5: Connect another wire from the ammeter back to the power pack.
Step 6: Cut a piece of wire of 20 cm using a ruler and put it in the
Step 7: Make sure all the apparatus is connected properly and the resistance
is not very low.
Step 8: Turn the power pack on and take a reading.
Step 9: Disconnect the circuit and connect it again and take another reading.
Step 10: Repeat step 9 again
Step 11: Repeat steps 1-10 again 3 times for another piece of wire of the
same length. Keep the length constant but vary the thickness
(cross-sectional area).
Observations
My observation has given me the following results that I have obtained:
Table (Varying length) – SWG 22
Table 2 (Varying length) – SWG 26
Table 3 (Varying Length) – SWG 28
Table 4 (Varying SWG/Thickness) – Length 10cm
Table 5 (Varying Length) – SWG 30
Table 6 (Varying Length) – SWG 32
Table 7 (Varying SWG/Thickness) – Length 10cm
Analysing results
My results support my predicted statement:
The thinner and longer the wire the high the resistance and lower the current. The thicker and shorter the wire the lower the resistance and higher the current.
As the length of the wire increases and the thickness decreases, the resistance increases and the decreases. As the length of the wire decreases and the thickness increases, the resistance decreases and the current increases.
I have calculated the gradient of each graph to prove the relationship between the current and the potential difference. Apart from the graph for the first table, all the rest show that it slowly rises and then a steep increase follows. The steep increase indicates that the wire is resisting or controlling the current. These graphs show the variation of resistance with temperature. In general, an increase of temperature increases the resistance of metals but decreases the resistance of semiconductors. We can see that constantan and nickel chrome wires act as thermistors at a certain temperature. The resistance of most thermistors decreases if their temperature rises, i.e. their I – V graph bends up, as shown in the graphs. These graphs undermine my prediction that my results in turn should produce a straight-line graph.
Except for the first graph, all the remaining ones are similar. However, the first graph obeys the Ohm’s law whereas the others do not. ‘Metals and some alloys give I – V graphs, which are a straight line through the origin… so long as their temperature is constant’. This statement relates to the first graph only. This graph supports my prediction, which is that my results in turn should produce a straight-line graph.
However, although constantan and nickel chrome are metallic conductors and are alloys they do not give a straight-line graph. The graphs show us that these wires do act as thermistors. They are not ohmic or linear conductors. The gradient of the graphs except the first proves this. If the gradient was the same or near enough the same, for example, 0.1 difference, then that would prove that constantan and nickel chrome are ohmic conductors.
Conclusion
The aim of my investigation was to investigate the factors affecting the resistance of a wire. By looking at my results I can tell that there is a relationship between the resistance and the
- Length of the wire
- Thickness/SWG of the wire
- Type of material (resistivity).
My prediction that my results will produce a straight-line graph and secondary source of data from ‘Letts Science Single and Double Award’ and ‘GCSE Key Stage 4 Longman Study Guides Physics’ do not support my results except for the first graph for table 1. Graph 1 was constant. Other graphs were curved showing that the material acted as a thermistor. My background information supports this.
The resistance of the wires varied with the temperature, which also shows why my preliminary work went wrong. As I was moving the sliding contact of the rheostat I was varying the temperature. More resistance meant less current, which meant lower temperature; less resistance meant more current, which meant higher temperature. This also shows that it was acting as a thermistor.
Part of my prediction was proven to be correct and is shown in my analysis of results. However, the other part of my prediction was proven to be incorrect due to my misunderstanding that constantan and nickel chrome obey the Ohm’s law. This is also shown not only in my analysis of results but also in my graphs and by calculating the gradient.
Evaluation
To improve my results, I could have got a second opinion in reading the reading on the ammeter, to ensure that I had not misread it. When I cut the piece of wire I did not check it again to make sure that it was the correct length. The wire was bent as it was obviously wrapped around the reel. Again, this affected the accuracy of the length of the wire. Therefore, my results were not perfectly accurate.
My teacher also helped me during the experiment. I knew what to do but somewhere my results did not seem correct. There was no constant pattern. However, there was a small pattern in the results in between them. Otherwise they kept on increasing and decreasing. The reason why my results were affected in my preliminary work was because instead of keeping the resistance on the rheostat constant it was being varied along with the length or thickness/SWG of the wire.
My results did point out an odd result. My first graph obeyed the Ohm’s law by producing a straight-line graph. Strangely, the rest of the graphs produced curved graphs, indicating that they act as thermistors. I would have understood if all the graphs for constantan would be straight-line but it was only one graph of varying length out of three graphs of varying length. The reason for these odd results can be justified by saying that as the resistance increases the energy is converted to other forms of energy, such as heat and light energy. This increases the temperature as the energy is converted. This causes the substance to act as a thermistor as the temperature exceeds room temperature and it is being changed. My results are sufficient enough to support my conclusion. The reliability of my results is quite good as I have a good range of results to support my background information and prediction.
It was beneficial that I took a range of readings because just in case there was a loose connection and I did not recheck it, my results would be incorrect. Therefore, it was a good idea to take three readings of each result. This way I could see if I made a mistake. My method was quite suitable. However, to improve this I could have put the piece of wire at the end of the clip so that the accuracy of the length would not be varied or changed.
To extend my investigation another experiment can be devised. Due to the fact that at room temperature the thermistor has a high resistance, its resistance falls when it is heated. It gives a lower resistor, a larger share of the battery voltage. This in turn will make the bulbs light up.
Thermistor (e.g. TH3)
By putting the thermistor at the top of the potential divider the total resistance will fall because the temperature will rise. This will mean that the voltage will get bigger. If this further extended improvement proves correct that means that the bulb will light up. We will know if this works by calculating the resistance and plotting a graph, which should produce a curved graph for a thermistor.