How does a Catalyst work?
A catalyst works by providing a convenient surface for the reaction to occur.
The reacting particles gather on the catalyst surface and
1) more frequently with each other,
2) more of the collisions result in a reaction between particles
because the catalyst can lower the for the reaction.
A catalyst is often used as a powder,
so that it has a bigger per gram.
In this experiment it is important that I take three readings and then an average for each concentration experiment. This is because of factors such as, temperature, water left in glass, and inaccurate measuring. It also makes the tests fair encase I get an anomalous result.
Prediction:
I predict that the stronger the concentration the faster the reaction rate will be. I’ve based my theory on the collision theory: ‘All atoms need to collide with a minimal amount of energy to react’ (A.Q.A Science). the higher the concentration of the thiosulphate, the faster the rate of reaction. I think this because there will be more thiosulphate molecules in 50cm3 of thiosulphate than in 30cm3 of thiosulphate with 20cm3 of water. This will result in a higher chance of a collision and therefore a greater probability of a successful collision and a reaction taking place. More chance of a successful collision means a higher rate of reaction.
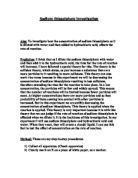
Variables:
To create a fair test certain aspects of the experiment that I will have to be kept the same while one key variable is changed. I have chosen to vary the concentration of the hydrochloric acid. The variables I’ll try to keep the same are:
-
The volume of the reactants 10ml of hydrochloric acid and 10ml of sodium thiosulphate.
-
The temperature of the liquids (room temperature) because that’ll alter the reaction rates.
-
The size of the cross that is placed under the beaker must be kept the same because if it’s bigger it’ll be easier to see.
-
The stopwatch used to measure how long the reactants take to react because some stopwatches can be fractions of seconds out.
All of these precautions will make my final results more reliable and keep anomalies at a minimum so thus make the entire investigation more successful.
Apparatus:
-
Square piece of paper with a cross drawn on it- to use as a focus point when timing.
-
Conical Flask- To hold the hydrochloric acid
-
10cm³ measuring cylinder- For measuring out the hydrochloric acid. Accurate enough to make results reliable.
-
2 x 50cm³ measuring cylinder- 1 for measuring the thiosulphate and the other for measuring the amounts of water. Accurate enough to make results reliable.
-
Sodium Thiosulphate- To use in the experiment.
-
Hydrochloric acid- To use in the experiment.
-
Safety goggles- For safety reasons.
-
Stopwatch- To time the experiment. Accurate to 100th second. Time will be rounded up to nearest 10th of a second to eliminate human errors when timing.
Fair Testing and Reliability
To ensure that the test will be fair and reliable I will do the following:
1. Use the same cross underneath the beaker.
2. Use all the same apparatus.
3. Take all of my readings on the same day to avoid a possible temperature change if I took them over two periods that could affect the results.
4. Always use the same person to start and stop the stopwatch as different people may have different reaction times.
5. Take all the Thiosulphate and Hydrochloric acid from the same batch to avoid slightly different concentrations.
Method:
- Collect and set up the apparatus as stated above.
- Place the conical flask on top of the piece of paper and then add 5cm³ of hydrochloric acid to the flask.
- Measure out, initially, 50 cm³ of Sodium Thiosulphate and then add this to the hydrochloric acid.
- Swirl the flask and then begin timing immediately.
- Watch the reaction and when the cross becomes no longer visible stop timing and record this time in a results table.
-
Follow the 2nd step again and but this time adding just 40cm³ of sodium thiosulphate AND this time 10cm³ of water/distilled water to keep the total volume of the reaction the same.
- Repeat each measurement 3 times to ensure reliable results.
- Repaet above steps for each required concentration.
- Record all these results in a table and draw up a graph..
In this experiment with the variable that I am using there are some factors that are out of my control. The main one is the temperature, if I do not manage to complete all my results on one day and have to continue on another then the temp may be different. As explained earlier when it is hotter then particles move faster. On some occasions I might not be completely accurate with my measuring. Also when I rinse the flask there will still be some water left inside and therefore it will slightly dilute the solution and cause it take longer.
Preliminary Results
Room Temperature was 25oC on the day of the prelims. The following are my preliminary results with different concentrations of Thiosulphate and 5 cm3 of Hydrochloric acid.
These results tell me that a 20% concentration (40 cm3 water, 10cm3 thiosulphate) will take too long and so my lowest concentration used in the full experiment will probably be a 40% concentration (30 cm3 water, 20 cm3 thiosulphate).
Doing just 3 concentrations did not show me enough so in my final experiment I shall do 5 different concentrations to ensure I have valid enough results to draw a firm and legitimate conclusion from.
RESULTS:
Conclusion:
The main points to note about the graphs are:
- The curve does not touch the x-axis at the higher end, because there will always be some particles with very high energies.
- The area under the curve is equal to the total number of particles in the system.
- The peak of the curve indicates the most probable energy.
The activation energy for a given reaction can be marked on the distribution curve. Only particles with energy equal or greater than the activation energy can react when a collision occurs.
In this experiment I have found that my prediction was right as the concentration is increased the time taken for the reaction to take place decreases. This means the rate of reaction increases as it takes less time for a reaction to take place, so more take places per second. Using the graphs, with lines of best fit, I can draw a conclusion from my experiment.
Firstly I can see the graphs have negative correlation in both cases, meaning that as the concentration increased the time taken for the reaction to take place decreases. Naturally, the above means that the graphs plotting rate against concentration has positive correlation as the concentration is increased so does the rate of reaction. This is because when the temperature is increased the particles will have more energy and thus move faster. Therefore they will collide more often and with more energy. When solutions of reacting particles are made more concentrated there are more particles per unit volume. Collisions between reacting particles are therefore more likely to occur.
Evaluation:
In my opinion the experiment was a very big successful. I obtained a substantial quantity of very accurate results from which I was able to create informative graphs. I obtained a good amount of results. However if I was to repeat the experiment I would also test the effect of temperature on the reaction time.
The range of concentrations was well chosen. This made my results more accurate and allowed me to make greater assumptions from my results.
I felt my method was well thought-out and provided fair and reliable results. To make my results more accurate I could have measured the volumes of liquids more accurately. If I were to repeat the experiment I would have possibly found a more accurate way to measure out the solutions and to determine the concentrations.
All my results followed the set pattern, but some were not as close to the line as others (slightly anomalous results). This could have been caused by human errors.
Overall I was extremely pleased with my results.