Aim:
For my investigation I want to investigate the effect of dropping height on the gravitational potential energy of my ball. I want to prove or disprove my hypothesis relating drop height with bounce height. I also want to work out where any lost energy in the experiment has gone.
The Preliminary Experiments:
I have chosen to use a ping-pong ball to investigate. I chose a ping-pong ball for my investigation because after quickly testing each ball’s bounce height, I found that its bounce height was most suitable for use with the equipment we had. Now I have chosen which ball to use, I need to carry out some preliminary experiments so that I can effectively plan my investigation. If I carry out preliminary experiments, I can predict what will go wrong for the real thing, and I will be able to exclude anything that wasn’t quite right from my method.
Aim/Method of Preliminary Experiment:
For my preliminary experiment, the ping-pong ball was dropped from three different heights. It was dropped from heights of 100cm, 200cm and 300cm from a measured distance up a staircase. Each reading was repeated three times and an average bounce height was found for each height. The height of each bounce was measured with metre rulers.
Conclusion:
There were no obviously anomalous results. I would say that my results are probably quite reliable because we made every effort to make the trial experiment fair, and my results turned out to be as I expected. The purpose of the preliminary experiment was to give me an idea of how my real thing would go so I would be prepared. I now know that the person reading the measurement on the ruler must always be the same person, and must view the ruler from the same place each time – head on. In the trial experiment, there were disputes over where the ball had bounced to because people were standing in different places, so the actual result looked different, depending on where people were standing. I also discovered from this experiment, that piling rulers on top of each other doesn’t work. They have to be firmly secured or held by two people. Otherwise, the ruler will slant slightly. When the ball bounces, the slant will cause all the ruler measurements to be lower down and the ball will read to be bouncing higher than it actually is.
Now that I have completed my preliminary experiments, and I know what to expect, I can start my main experiment.
What is the Effect of Dropping Height on the Bounce Height of a Ping-Pong Ball?
Hypothesis:
I hypothesise that an increase in dropping height will bring about a directly proportional increase in Gravitational Potential Energy. This is because as the ball ascends higher from the surface of the earth, the gravitational force of the earth will try to pull it back down. This gives it a certain energy, which is called gravitational potential energy. The equation for gravitational potential energy is:
Gravitational Potential Energy = mass (kg) x Gravitational Field Strength x Height (m)
An increase in gravitational potential energy will give the ball more energy to convert into kinetic energy with which it moves. The amount of kinetic energy needed for the ball to reach the ground will increase as I increase the dropping height. The GPE is transformed into kinetic energy and this is stored, making the ball move faster. If a ball has more kinetic energy/velocity when dropped from greater heights, this energy will not all be lost when the ball is falling and hitting the ground. As soon as there is a collision, both the floor and the ball dent slightly and the remaining energy in the ball is converted into elastic potential energy. The ball and the floor have no energy being exerted on them to stop the potential energy from being used, so this energy is converted back into kinetic energy as the ball and the floor repel each other to return back to their natural shape. The ball leaves the floor and keeps rising upwards due to the amount of kinetic energy stored in it. The more kinetic energy the ball had to begin with, the more it will have stored now and the more it will be able to keep on rising before its energy runs out. With the height it gains in the bounce, it again has gravitational potential energy to come down again, but this cannot be used to make the ball continue rising even further because gravitational potential energy is stored as a result of the gravitational attraction of the earth for the ball and it can only be used to reach the ground. A ball having more gravitational potential energy when it is dropped means it will have more kinetic energy when it hits the ground. There will be more energy left stored in the ball after the ground has been hit and the ball with bounce higher. Therefore, I predict that the drop height of the ball will be directly proportional to its bounce height. I predict that my graph of results showing this will show direct proportionality, and have a straight line through the origin.
Apparatus Needed:
One Tape measure
One Caliper
One set of electronic scales
One standard size ping-pong ball
Two Metre-long Rulers
*There must also be access to a staircase that rises to at least five cm (500cm) from the ground.
Diagram:
Method:
A tape measure was used to measure where on the stairs the height we desired from floor to staircase was. We found where we should stand on the stairs for measuring all the heights from 50cm to 500cm with 50cm gaps in-between each. Next, the ping-pong ball was measured and weighed so that when it came to doing energy calculations relating to kinetic energy or work done (energy transfer), I would be able to put numbers into them, and form conclusive results. Two metre rulers were stood on top of each other in front of the 50cm mark and held firmly in place by two people so that they were not slanting or leaning against the staircase. The ping-pong ball was taken to the place on the staircase we had measured to be 50cm from the ground. The ball was dropped from this height alongside the metre rulers with no force exerted on it. A different person standing on the ground directly in front of the metre rulers noted the height of the bounce. This was done three times and an average bounce height for a 50cm drop height was found. The whole experiment was then repeated using different drop heights of 100cm, 150cm, 200cm, 250cm, 300cm, 350cm, 400cm, 450cm and 500cm. The same person dropped the ping-pong ball each time and the same person noted the bounce height each time. The same ping-pong ball was used for each experiment. For each drop height, an average was found and the results recorded.
How I Plan to Make my Results as Accurate and Reliable as Possible:
I will try to do as much as I can with my experiments to reduce the chance of human experimental error and to make my results reliable and accurate.
I will go through all the factors that affect the bounce height of a ball, and change only the drop height. I will try to keep all the other factors constant if I can.
Factor one is surface area of the ball. This factor will be kept constant because the same ping-pong ball is being used for each experiment. The surface area won’t vary from experiment to experiment.
Factor two is pressure inside the ball. If the same ball is being used for each experiment, the pressure inside the ball will also remain constant.
Factor three is the material of the ball. Again, if the ball is not changed then this factor will remain constant. This is the same for factor four. The material of the floor will not change because the experiment is being carried out in the same place each time and the floor alongside the stairs is the same all the way up.
Factor five; the force at which the ball is dropped at will not change because the same person is going to be the one to drop the ball each time. This means that if a person exerts a force on the ball without realising it, they probably do it with all the experiments. Using the same person means that although the results will be slightly incorrect due to this human error, the percentage error will always be roughly the same. The incorrect results will be relative to what they would have been. Also, the person dropping the ball will try as hard as they can to simply hold the ball lightly between finger and thumb, then simply letting go without pushing it at all. Hopefully, there should be very little percentage error due to this factor.
Factor six, accuracy of measurement will be the hardest factor to keep constant because it is impossible to get completely accurate results in an experiment like this with the equipment we are provided with. Human experimental error is a problem because things like reaction times, eyesight and our own judgement cannot be changed and they do affect the end results quite considerably. Unlike some other factors, the percentage error cannot reliably be found when it comes to human error. This is because it is impossible to know how long someone’s reaction time was to read the measurement on the ruler when the ball stopped bouncing. The ball might have already been on its way down when the person read the measurement on the ruler. It is also impossible for us to measure how much accidental force the person dropping the ping-pong ball exerted onto it when it was dropped. Sometimes, readings are read wrong due to bad eyesight, and there is no way for this error to be found. These problems cannot be fully controlled with the equipment available but steps can be taken to avoid them. This is why the same person reads the bounce height off the rulers, and they stand in exactly the same place for each experiment. This is why the same person drops the ball each time. This is why the rulers are held as straight as possible by two people to prevent human error in reading the results.
Safety Precautions:
For most experiments, special safety precautions have to be made so that no one gets harmed in any way. I will make sure that no-one is walking underneath where the ball is going to be dropped so that no-one gets struck my a fast moving ball. I will pick up any dropped balls immediately so that nobody trips on them. I will not lean right over the stair rail at any point during the experiment. I will be careful when walking up and down the stairs so that I don’t trip and fall.
What I can do with my Results:
When I have got a set of results, I can use them to prove or disprove my hypothesis, relating GPE with drop height and bounce height with drop height. I can exclude any obviously anomalous results from my results. I can then draw a graph of my results. The line of the graph will show me what my results mean. A straight line through the origin will show direct proportionality. If all my points line up neatly along the line of best fit, I will know that my results are likely to be reliable and correct.
Obtaining Evidence:
All my tests dropping the ping-pong ball from varying heights along a staircase behaved in the same way. The higher I moved up on the staircase, the higher the bounce of the ball became:
My results on the whole came out much like I’d expected. The experiment went to plan and I didn’t find there were any major unexpected difficulties I had to overcome. I do have one anomalous result in the reading for the 500cm drop height. I will have to exclude that result from my results because it doesn’t fit the pattern the other results are following. My new average bounce height for a drop height of 500cm is 181cm.
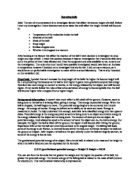
Graph to Show the Drop Height of a Ping-Pong ball against Its Average Bounce Height.
Conclusion:
My hypothesis was slightly incorrect. I predicted that my graph would have a straight line through the origin. Instead, my graph was a curve, showing that when I was using the lower drop heights, more of the available kinetic energy was stored and used in the bounce. As the drop height increased, more and more of the kinetic energy in the ball is lost during the fall and collision with the ground and so the difference between the bounce heights gets smaller. The average bounce height starts increasing less and less the higher the drop height becomes.
I think this is because there is an energy-wasting factor that I overlooked. I overlooked friction due to air resistance in my hypothesis. The higher the ball is dropped from, the more GPE it has to convert into Kinetic energy, and the faster the ball goes. As the velocity of a ball increases, so does the air resistance acting on it. The ball will lose much energy this way.
When the ball is falling, it loses some kinetic energy due to friction with the air resistance. The faster the ball’s velocity when it is falling (i.e. the more kinetic energy it has stored), the more air resistance it will have and therefore the more kinetic energy it will lose with friction. Therefore, the higher the drop height, the more energy the ball loses while it is falling. Obviously, this makes the line of our graph gradually get less steep and form a curve. In an ideal world, where there is no air resistance and no energy is lost or wasted with friction and sound, I predict that there would be an element of direct proportionality and my graph would be a straight line through he origin.
After looking at my background information, and studying how high my ping-pong bounced in comparison to other balls, I couldn’t work it out. For some reason, the ping-pong ball bounced the same if not more than e.g. the tennis ball when dropped from the same height. I didn’t expect this because a tennis ball is squashier than a ping-pong ball. Therefore I expected it to be better at turning the kinetic energy into elastic potential and repelling the ground. However, after thinking about it hard and studying the factors that affected the bounce height of a ball, a came to a conclusion why this might be. A ping-pong ball is very light. Work done is the same as transferred energy and its formula is:
Work Done = Force x Distance
The force needed to lift the ping-pong ball is equal to its weight. The ping-pong ball had a mass of 3 grams, which is a force or weight of 0.03 Neutons. This is considerably lighter than any of the other balls I could have used. If a heavier ball was used to find the work done by the floor and the ball with the same experiment, the work done would have come out as higher.
Work Done = Weight of Ball x Bounce Height
The higher the weight of the ball, the more energy the ball/floor is going to have to use to push the ball back into the air as a bounce. The ping-pong ball needs less energy than a heavier ball to bounce the same distance because it requires a smaller force.
Also, a ping-pong ball is a tight structure and doesn’t sag at all or squash much. This means that is highly pressurised in the middle. Therefore when the ping-pong hits the ground, it doesn’t need to be dented as much as other balls to release the same amount of potential energy needed for the bounce. The energy comes from the pressure inside the ball pushing the ping-pong ball back into its normal position from inside. The pressure inside gives an added energy because it is constantly pushing against the sides of the ball.
In order to prove my hypothesis correct that drop height is directly proportional to the amount of gravitational potential energy stored in the ball I am going to make some calculations using the formula for GPE.
The GPE formula is:
GPE = Height x mass x Gravitational Field Strength.
Using this formula, I can work out how much GPE the ball had at the start of each experiment, and after the ball has bounced. I can then work out how much energy has been lost overall and work out how efficient the ball is.
Now, the amount of energy lost between the dropping and the end of the first bounce can be measured:
This shows that my new theory on why the graph is a curve is probably true. These results clearly show that the higher the drop height, and the more energy the ball has to begin with, the more energy that is lost altogether. The only way of explaining all of this is with my theory that air resistance is to blame for the wasted energy, causing my graph to curve.
Evaluation:
Overall, I think that my results were as accurate and reliable as I could make them with t he equipment I was provided with. I don’t think that seeing how far a ball bounces alongside a ruler and getting a person to measure the bounce is a very accurate or reliable way of carrying out the experiment. There is too much risk of human or experimental error. The ball could have been dropped by mechanical means to make sure that no force was exerted on it. Once my one anomalous result had been excluded, all my results did fit the line of best fit quite closely, which helps to prove that my results are reliable. My anomalous result was probably due to experimental error e.g. slow reaction times etc. but it could have also been because it was at the extreme of my range of readings – the very last set of readings I carried out.
I had enough evidence that I could study to work out why my graph was a curve instead of a straight line. I also feel that I had enough evidence to back up my conclusion. All my results did follow a pattern. I didn’t have any unexplainable results because I took enough tests and averages to even out any slight glitches in the pattern.
If I could extent this experiment even further, I think I would carry out the same experiment with a different ball. This way, I could relate the results I have gained with a ping-pong ball with results with say a tennis ball. The pressure inside a tennis ball is different to that of a ping-pong ball. It would be interesting to see what difference this makes to the results. Also, the tennis ball is made of a different material and is squashy. A tennis ball has a bigger surface area than a ping-pong ball because it is bigger. I predict that air resistance has more effect on a tennis ball than it does on a ping-pong ball. Therefore I predict that the graph will look very similar in direction, but the graph for the tennis ball will start to curve more dramatically quicker than the ping-pong ball does. This is because the tennis ball will be losing more energy due to air resistance.