I do not need to worry about temperature or light conditions. Because I will leave them in a lab overnight, I know that the temperature will stay above freezing so the solution will stay liquid and osmosis can occur. Even though it gets dark at night this should not affect the experiment, and the conditions are the same as they would be in the chip shop. Therefore all the beakers will have the same conditions which will help to make the test fair.
After 24 hours I will take out the slices of chips and weigh and measure them to see if they have changed size or mass. I will also look and feel them to see if they have changed texture or colour.
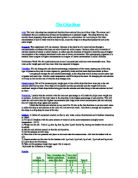
I will then record my results on a table.
Results
My results are shown in table 1.
I have drawn a graph of my results which is shown on graphs 1,2 and 3,4,5.
Overall my results and the graphs show a general trend that at higher molar solutions the chips are placed into they will loose water and as the molar of the solution falls the amount of change is less until they do not change at all around 0.25 molar solution but at 0M solution distilled water they gain weight and size. This shows that the best conditions for the chip shop man to keep his chips without a change in size is around 0.25M salt solution. If he wants the best texture then the distilled water is best because the chips stay crisp and firm at 0M.
This means that the weight and dimensions of the chip have stayed most like the start chip size although they have grown in size. The worst solution to place the chip into is the one molar solution because the chip’s size, weight, texture and colour have changed quite a lot.
When I looked at my graphs I tried different ways of drawing them and no matter how I drew them they always showed the same pattern. So I decided to look at them all closely. First of all I looked at length – graph 2. The chips stay similar to the start (3.8 cm) in the one molar (well one chip stays the same as the start and the other drops to 3.5cm as apposed to 3.8cm, this could have been an anomaly in my data which would account for the difference in size of the two chips in the one molar solution) then the size drops dramatically in the 0.75 to 3.2 cm and then more then gradually rises through the 0.5 and 0.25 until the distilled water where it is the same/ larger than the start chip was.
The width (graph 3) of the chip was similar where The size starts at 0.75 cm and drops to 0.5 at 1.0M solution then rises gradually til it reaches the maximum at 0M where it is 0.8 cm.
The depth (graph 4) of the chip is similar. It starts at 0.7 cm and it falls gradually until it reaches its lowest point at 0.5M solution where it is 0.4 (chip B) and 0.5 (chip A) and then it grows gradually till it reaches 0.9 for both chips in the distilled water.
I showed the information in 2 ways on graph 2. On the left side I graphed start and end sizes, but I did not think the left graph was very clear but the one on the right is better where I did solution against size. But it is still possible to read the same findings from both left and right graphs.
So my results show that all dimensions of the chip followed the same general pattern but they reached the lowest point at different solutions.
I think that chip A length in the 1M solution might be an anomaly because it seems unlikely for it not to change at all and then in the 0.75 solution for it to be the lowest of all the readings for length, so this reading could be an anomaly also. When looking at chip B for length, the changes occur but they look much more reasonable because they are not so extreme. I don’t think that any of the other readings are anomalies.
When I looked at the graph for mass (graph 5), the pattern is similar. The heaviest chips A & B are in the distilled water. The next heaviest were in the 0.25 solution where they are just below the start weight. I decided to find out which one was closest to the start weight. I thought it would make more sense if I worked out the percent change, and I thought that if I looked at the average change it would remove the differences between the chips like Graph 2, 0.75M solution A and B are far apart and also for 1.0M these are far apart so they could be anomalies.
Distilled water – chip A = 1.9 x 100 = 105.5%
1.8
chip B = 2.2 x 100 = 122%
1.8
The average gain has been 105.5% + 122% = 113.75%
2
The chips at 0.25 M solution are under weight. I decided to see whether they were much more underweight than the distilled water ones were overweight:
0.25M chip A = 1.6 x 100 = 80%
2.0
0.25M chip B = 1.5 x 100 = 79% (rounded)
1.9
The average loss has been 80% + 79% = 79.5
2
I compared these two readings to see which chips were furthest away from the start: This will tell the chip shop owner which chips are closest to what he started with before he put them to soak. I only needed to look at 0.25M and the 0M solutions because these were the ones closest to the original weight, and the others did not matter for the chip shop owner because he will not use them as they are too far from the original size.
100-113.75 = 13.75% for distilled (0M)
100-79.5 = 20.5% for 0.25M
This means that the man should use the distilled because the change in the chips is less. There is another reason why the water is best, and that is that the chips will be heavier so if he sells them by weight he will get more money.
The other graph I drew was not very helpful. I tried to plot start measurement compared with end measurement. All this gave me was a graph showing overall change on each dimension. It was quite helpful for showing the biggest changes but there was nothing to compare it with so it was not that helpful.
Because potatoes are hard I think that they have a very hard cell wall which will prevent the cells from expanding too much when the water goes into the cells – with the distilled water - and although the cells will become turgid they will not swell up to much so they wont take so much water in that it will affect the taste of the chip. I am not testing the taste of the chip and so this will not be my problem if the chip is watery but I can make an estimated guess as to what will happen and that is that the water will not affect the taste of the chip because not enough can get in.
I think that the water has gone into the chip because of osmosis. The sap in the potato is of a higher concentration than the water so the water has moved into the potato to try to even up the concentration either side of the cell walls. With the higher molar solutions, the fluid has gone out of the potato into the solution because the concentration is higher outside than it is inside. I am surprised that the concentration in the potato is so low. It is closer to pure water than it is to the lowest concentration solution because loss with the 0.25M solution is a lower percent than the gain with the 0M solution. This is surprising because I thought the concentration would be high in the potato because it is storage of food for the plant.
The results do agree with my prediction, but I thought the concentration in the potato would be higher.
Evaluation
if the chip shop owner wants a solution for the chips that will keep them as close to the start sized as possible then he should keep the chips in distilled water for the allotted 24 hour period because the chip hardly grows at all and is the most similar to the start chip, and because it’s heavier he may even make some more money.
The method I used was quite good. I used the same time as the chip shop owner would, so it was realistic for the experiment I was doing. If I had left the chips for longer they may have made a bigger change but this was not needed because it was not realistic for keeping food for a chip shop. I could have recorded the changes at intervals to see if the change was even – say every 4 hours but this was difficult because I could not be there to do the test. It could be that the change is very fast at first then slows down, or very slow to start and then speeds up or it is constant. This could be interesting for the chip shop owner to know about because if he has a choice of how long to keep the potatoes that would help him decide. If I was to do the experiment again I think I would do more readings so I could tell the man more. As it was the method worked out very well. It was simple to carry out and easy to get a result, so I was quite pleased with it.
I think my results were quite accurate. I used a ruler to measure the chips and corer to cut them to make sure they were all the same size. When I measured them they were all the same size, so the method of cutting the chips was quite accurate. The ruler was also quite accurate but I think that if I used a more scientific ruler it may be even more accurate. By using two chips in each measurement I could look at the average change if there was a difference. Sometimes the two chips gave quite different readings which could be quite worrying since they are supposed to be the same, but the trends were still the same so I felt quite happy with that. The chip shop owner will have different sized chips from mine, because mine were quite small and his chips will all be different sizes, so maybe I should have experimented with different sized chips. I received a stock solution of 1M concentration which I then diluted to make up the other strengths, except 0M which was just distilled water. I presume I measured them accurately, but this is another place where an error could have occurred because I have not done this sort of thing much before and I could have made a mistake. Overall I think the measurements are accurate and quite good for the test being done.
To improve the test I could have used a metal scientific ruler or callipers to measure the chips, or a chip cutting machine to make all the chips identical in size. I could be more careful about the amount of solution I poured into each beaker and I could have tested the solutions to make sure they were the correct concentration. I could also control temperature and light in the experiment in case these changed the results. I could also have used a larger number of chips so that I could take averages. In some reading such as graph 2a you can see that the A & B readings are quite different for 0M and 0,75 M so if I had more chips – say 10, I could take an average and this would more likely be more accurate.
I think that the evidence is reliable and strong enough to come to a strong conclusion. Because I have 2 readings for each by using 2 chips, this gives good results which I can rely on. If one reading seems very different from the trend then I can see that that is an anomaly. I did not get many results that I thought were anomalies, but if I had then it would have been helpful and more reliable to have the two results for each reading. This made my results more accurate.
I could do the experiment over a longer time and test for more things. The chip shop man may find it better to keep the chips more than 24 hours. I could carry on the experiment to see if this would be possible without the chips losing texture any more. I did not test for taste because we did not have cooking facilities but I could get my teacher to make an arrangement with the chip shop to test the different chips so we could do a taste test to see which are the best. A taste test is important for the chip shop because the way I recommend he keeps his chips is in water but if the customers think the chips have gone watery they will not buy them. I know they will absorb some water but I don’t know whether this will affect the taste.
Bibliography
- BBC Bitesize GCSE Biology
- GCSE higher level Double sciences Biology revision Guide-The Coordination Group Publication
James Haines-Young
Class 10PG
GCSE Biology coursework - –