Once that is completed, I was ready to place the chips into the test tubes. Starting with the 20 cm3 of water test tube, I put two potatoes in each at two-minute intervals. Making sure to cover them with lids once the chips were in.
All of this I repeated for a second time using the remaining six test tubes.
Once I had cleared away all my apparatus, the only thing left to do was to come back to obtain my results.
When obtaining my results, using forceps I removed each pair of chips from their test tube at two-minute intervals and placed them on a paper towel. Making sure to label which test tube they came from and each chip as a1, a2, b1, b2 etc.
Then it was time for me to measure them using a ruler, making sure to record the results down I also weighed each potatoes chip on the top pan balance. Once all my results were recorded on a neat table and I had packed away, I had completed the experiment.
Why was it a fair test?
My experiment was a fair test because everything was considered and measured properly. For instance every chip was exactly the same length measured accurately with a millimetre ruler to 4 cm even more importantly they were the same width and volume (as a cork borer was used). Also by me putting the chips in at two-minute intervals and also taking them out at two minute intervals meant that each chip was in the solution for the same amount of time. Also all of the chips were taken from the same batch of potatoes, which makes a big difference, because if they were taken from two specimens then they will more than likely have different water concentrations. A small factor but important is the size of the test tubes, which I kept all the same at 6 x 3 cm and labelled them twice showing their volume of sat solution and their volume of water.
Safety factors
Although the experiment was quite a simple procedure, as always safety precautions still had to be taken. For instance when shortening the potatoes chips with the scalpel, as you are cutting such a small amount it is easy to slip, but if you take your time and care you will not. The only other precaution would be with handling the test tubes as they are made from glass, but if you have a clear work top and stand up while doing the experiment everything should go according to plan.
Prediction
What is osmosis?- osmosis is the movement of a solvent such as water through a semi-permeable membrane, separating solutions of different concentrations in my case this may be the salt solution or water. The solvent passes from the higher concentrated solution to the dilute solution until they are both equal. Osmosis is a vital mechanism in the transport of fluids in living organisms-for example, in the transport of from the roots up the stems of plants.
The solution has moved from that of a high water concentration to that of a lower concentration. This therefore means that they finally both become equal concentrations.
This information can now help my prediction.
I predict that potato cylinders that are held in the 100% water solution will be the ones that will grow in size and increase in mass. This is due to osmosis, alike the diagram water moves from a high concentration in this case the test tube to a low concentration which is the chip. This then causes the chip to become turgid. On the other side of the scale I predict that the chips held in 100% salt solution will be the ones that have the lowest mass and the smallest in length. This is also due to osmosis the water will be moving from the chip this time and into the test tube surroundings. This then causes the chip to become plasmolysed and shrink/shrivel it also causes them to decrease in mass.
I can use my preliminary work to secure my prediction. As this exact thing happened.
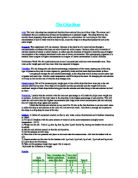
A graph to show the percentage change in mass
Against the concentration of
Salt solution
What the graph tells us
The main trend in this graph is that, as the concentration of salt solution increases the potato chips becomes smaller. You can see on the graph that when the concentration is at zero percent (meaning there is only water present) the change in mass is a positive number. This then tells us that the potato increases in mass by 33.5 %. But then once there is 20 % salt solution present the potato cylinder no longer increases in mass by a large amount but only by 2 %. As soon as the concentration of salt solution is 40 % the cylinder begins to decrease in mass by 9 % and that is why it is shown as a negative number. The cylinder decreases in mass at a steady rate until the salt solution is at 80 % where the rate begins to slow down. Then at 100 % concentration of salt solution instead of cylinder continuing to decrease in mass further, the percentage change is actually smaller than at 80 %. With the change being 21% rather than 24%.
We can see from the graph that the point of change for the cylinder is when the concentration of salt solution is 24 %. This is where the cylinders mass is no longer increasing but begins to decrease in mass. There is a very big change made at the concentration going from 0 % to 20 %. The mass changes from increasing by 33.5% to only 2 %, this is something that I will need to take into consideration. As I did not think this would happen and did not state it in my prediction.
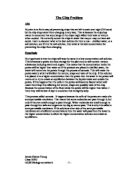
A graph to show the percentage change in length
Against the concentration of
Salt solution
What the graph tells us
The trend in this graph is a lot like the graph showing mass. As the concentration of salt solution increase the potato begins to decrease in length. When there is 0 % of salt solution the potato cylinders length increases by 0.75 %, which is the equivalent to 2.8-mm. But that is the only increase in length, because once there is a 20 % salt solution the length of the cylinder rapidly decreases by 0.65 %. But unlike the mass it does continue to decrease at a steady rate but instead it decreases very slowly. At 80 % salt solution there is a slight change in the pattern because the length does not decrease more but it does not shorten as far as it did with the salt solution being 60 %. This means there is a slight upwards curve in the pattern of the graph. At 100% salt solution the cylinder does decrease by a further 1.3 %.
The point where the cylinder moves from increasing to length to decreasing is at approximately when the concentration of salt solution is at 10%. From 40 % salt solution the change in length of the cylinder begins to even out, there are no rapid decreases or increases, but instead it stays around the same point being –1.15 %.
When the graphs are put together on the one axis you can compare them a lot easier. You can see that the rate in change are both very alike they both slow down at 40 % salt concentration. Also at one point they both have a slight increase in the length of the cylinder e.g.- mass =at 100% salt concentration and length = at 80 % salt concentration.
Conclusion
At this point I can now draw a conclusion on the experiments using the evidence I have found.
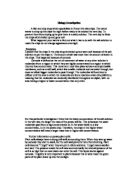
I can now say that it is proven that when there is no salt solution present in the test tube, the water in the tube, which is of a high concentration, can pass freely into the potato cylinder, which has a low concentration, by osmosis. This then causes the glucose rich (the potato) region to fill up with water. This potato cylinder now becomes turgid (they swell) which causes them not only to increase in length slightly but also in mass. I say slightly because the cylinder can only grow to certain point as the cell wall limits the growth.
Turgid cell
On the side of things when you have a test tube that is either 80 or 100 % concentrated with salt solution the potato cylinder does the exact opposite. To be fair it starts doing this from about 20 % concentration of salt solution. The potato cylinder loses water because it has a high concentration of it and this water gets passed into the outside solution because it has such a low concentration of water, once again this is the process of osmosis. This causes the potato cylinder to decrease in size and in mass, the chip becomes what we call flaccid which is very soft and limp, compared to the turgid cell which is very hard and rigid. If the chip were left in a 100% salt solution for a long time then it would become plasmolysed.
Flaccid/ plasmolysed cell
But there is always the point in the middle where the rate is slowly decreasing in pace. This is where it almost has reached the optimum point.
This supports my prediction almost perfectly. As I predicted that the length and mass would increase for the 0 % salt solution test tube and would decrease in size by the time you got to 100% salt solution. What I did not take into consideration how ever in my prediction was at what stage would the potato cylinders begin to decrease in mass and length, but obviously now that I have the evidence I can say.
The Experiment
As a whole the experiment was quite successful, but as everything there are always room for improvements. The instructions were given were simple and easy to follow, but it took time and care to ensure maximum safety and accuracy.
Improvements
If I was to change anything about the procedure, I would not do both experiments on the same day but instead I would do one then the other. This would allow me to concentrate more on that certain experiment, as things can become very confusing. But there is also a downfall to this method. Doing them on separate days could mean jeopardising if is a fair test as there may be a change in temperature. Also when using the top pan balance things became very rushed as there was limited amount of time, so a solution for that maybe to either weigh them at a separate time or taking a top pan balance from another room. When it came to measuring the chips I think it could be a bit more accurate than using a ruler, but we had to be practical and that is the only means of doing with the facilities available.
My results
My results were not all perfect as I did manage to find some anomalies. There are reasons why I may not have achieved a fully accurate set of data such as. It was unfortunately not possible for me to take the chips all from the same potato, and resulted in me using over four. This affects my final results as each different potato can contain different concentrations of water, which will then throw off my results. Another fact that may have given me a few anomalies with the mass data, could be the top pan balance if it was not put at zero before each measurement.
The anomalies in my results were found in the first experiment with the salt concentration being 100%. I found their change in length to only be 3mm when they should have been approximately 6mm. however these anomalies were all accounted for and were not used for further calculations. (Refer to the results table where they are all clearly highlighted)
In the Future
In future I can help to prevent these anomalies by instead of doing two experiments do three or four which will then give me a bigger range of results to compare with. As a further point I could also measure the ‘angle of dangle’, which may help come to a final conclusion. By using the angle of dangle it would have been a more accurate way to say how soft or limp the chip was. It would have allowed me to see how limp the chimp was by accurately seeing the angle at which it bent, another option that may not be as accurate would be to as I did in my preliminary tested the hardness of the chip simply using my fingers
The experiment did give enough evidence to support my conclusion, because the two main factors were found, length and mass. I must take into consideration the reliability of my results and my final conclusion, so a lot research needs to be done in order to prove this. Apart from using biology textbooks which help me to compare my theory. I have compared my conclusion with other students in my class. I found that we all have the same trend and pattern in our graphs, which led to an accurate conclusion. When comparing with other students I had to take into consideration that they may have some anomaly results, so not to take their results as an perfect example. So to overcome this I used six students’ results.