In order to produce replicable results, each experiment will be repeated 3 times, so as to highlight any anomalous results that could occur and produce data from which I can draw decisive conclusions. The more the experiments are performed, the more reliable the data obtained. Due to the time scale of the school week, I can only run this experiment keeping to the time table-and for a five-day period. However, I feel that this is enough to draw reliable conclusions bearing in mind that the consumption date is three days after opening, thus enables me to try to prove my hypothesis.
Colony Morphology and Growth
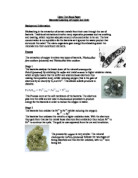
Colony development on agar surfaces aids the microbiologist in identifying bacteria because individual species often form colonies of characteristic size and appearance. The structure of bacterial colonies can also be examined with the scanning electron microscope. Generally, the most rapid cell growth occurs at the colony edge. Growth is much slower in the center and cell autolysis takes place in the older central portions of some colonies. These differences in growth appear due to gradients of oxygen, and nutrients, and toxic products within the colony. The colony edge, oxygen and nutrients are plentiful. The colony centre, of course, is much thicker than the edge. Consequently, oxygen and nutrients do not diffuse readily into the centre, and growth in the colony centre is slowed or stopped. Because of these environmental variations within a colony, cells on the periphery can be growing at maximum rates while cells in the centre are dying.
Much of the microbiology depends on the ability to grow and maintain microorganisms in the laboratory, and this is possible only if the suitable media are available. In addition, specialized media are essential in the isolation and identification of microorganisms, the testing of antibiotic sensitises, water and food analysis, industrial microbiology, and other activities. Although all microorganisms need a source of energy, carbon, nitrogen, phosphorus, sulfur, and various minerals, the precise composition of a satisfactory medium will depend on the species one is trying to cultivate because nutritional requirements vary so greatly. Knowledge of a microorganism’s normal habitat often is useful in selecting an appropriate culture medium because its nutritional requirements reflect its natural surroundings. Frequently a medium is used to select and grow specific microorganisms or to help identify a particular species. In such cases, the function of the medium also will determine its composition.
There are a number of different methods that could be used:
The spread plate and streak plate:
- If a mixture of cells is spread out on an agar surface so the every cell grows into a completely separate colony, a macro-scopically visible growth or cluster of microorganisms in a solid medium, each colony represents a pure culture. The spread plate is an easy, direct way of achieving this result. A small volume of dilute microbial mixture containing about 100 or 200 cells or less is transferred to the centre of an agar plate and spread evenly over the surface with a sterile bent-glass rod. The dispersed cells develop into isolated colonies. Because the number of colonies should equal the number of viable organisms in the sample, spread plates can be used to count the microbial population.
The pour plate
-
Extensively used with bacteria and fungi, a pour plate also yields isolated colonies. The original sample is diluted several times to reduce the microbial population sufficiently to obtain separate colonies when plating. Then small volumes of several diluted samples are mixed with liquid agar that has been cooled to about 45° c, and the mixtures are poured immediately into sterile culture dishes. After the agar has hardened, each cell is fixed in place and forms an individual colony. The total number of colonies equals the number of viable microorganisms in the dilute sample. Colonies growing on the surface also can be used to inoculate fresh medium and prepare pure cultures.
To improve technique, I practiced these methods on the plates to improve my skills and to find the most comfortable and affective method for my experiment. This has improved my aseptic techniques for microbiology.
(The preceding techniques require the use of special culture dishes named petri dishes or plates after their inventor Julius Richard Petri.)
The most efficient method of culturing the bacteria would be the spread plate technique. It is the simplest and easiest method and produces a clear and concise result-you can clearly see the areas of bacterial growth and requires less materials (no need for the liquid agar). For this particular experiment I am going to use agar in petri dishes-hardened-and then spreading a small amount of milk over the surface and spreading it evenly with the glass rod to see if the bacteria will grow on this surface.
(Agar is a sulphated polymer composed mainly of D-galactose, 3,6-anhydro-L-galactose, and D-glucuronic acid. It is usually extracted from red algae.)
Safety- culturing bacteria
- Any cuts should be covered with a clean, waterproof dressing before any work attempted
- Do not eat or drink during practical work and avoid sucking pens or pencils
- Windows and doors should be closed to avoid the possibility of airborne contamination
- Wash your hands with anti-bacterial soap before and after working with microorganisms
- Wipe down the bench with disinfectant such as 10% sodium chlorate (I) before and after working
- Report any spillages of cultures to your teacher immediately
- Tape petri dishes securely after spreading them, and label
- Never remove the lid of a sealed petri dish
- Never incubate cultures of microorganisms above 30ºc
- Sterilize all media and containers by autoclaving after use
- Dispose of all cultures in plastic petri dishes after use by placing them in an autoclavable plastic bag and autoclaving them at 103 kPa (121ºc) for 20 minutes
- The milk, although not a damaging substance, must be labeled, to inform people that it is in an unfit state for consumption, as this could potentially lead to illness
- Any apparatus that has been exposed to the decaying milk should be washed thoroughly to ensure the disposal of all the bacteria. Gloves are not required when handling this substance.
- When using the glass apparatus, special care must be taken as these can break easily and cause injury
Care must be taken at all times during the investigation due to a series of safety risks posed by the experiments.
Risk Assessment:
Apparatus-culturing bacteria
- Alcohol-ethanol
- Bunsen Burner
- Smearing glass rod-spreader
- Milk agar plates
- Sterile water-9.99 concentrating
-
Incubator- 25°c
- Pipette-1cm³
- Disinfectant
- Cotton wool
- Sellotape
- Pen
- Heat proof mat
- Agar covered petri dish
The recipe for the agar plates was obtained from ‘ Philip Harris Unilab catalogue’ :
28g ‘‘Oxoid (make) Nutrient Agar’
1 litre of distilled water
Method- suspend the agar in the water and bring to the boil to dissolve completely. Sterilize by autoclaving at 121°c for 15 minutes.
This recipe makes 100 plates-one plate contains 10ml of nutrient agar.
Method
- Wash hands
- Prepare the surface-i.e. the bench you are working on, with some form of disinfectant with some cotton wool.
-
Take 0.1cm³ of the milk and place the amount on the surface of the agar plate without taking the lid off fully-to reduce the amount of air the agar/bacteria is exposed to.
- Replace the lid and take the glass rod and dip it in the ethanol and immediately place it over the Bunsen burner to disinfect the rod, repeat a couple of times.
- Again, without taking the lid off fully, slide the rod into the plate and smear the milk around to give a consistent and full covering over the agar plate.
- Replace lid and sellotape the edge-not covering the whole plate as to allow air to still reach the bacteria.
- Never open a sealed petri dish
- Label the plate.
- Repeat the procedure, but with diluting the milk:
-
Take 0.1cm³ of the milk, unscrew the lid of the sterile water bottle, and hold the opening of it in the flame for 2 seconds. Place the milk sample in the jar of the 9.99 sterile water concentration.
-
Replace the lid and shake. Again heat the entrance of the jar and take 0.1cm³ of the mixture (now being 1: 10 dilution factor)
- Repeat the method of the smearing and seal the jar.
-
Repeat the dilution of the milk in the sterile water (taking a 0.1cm³ sample from the 9.99 and placing it in another jar of 9.99 sterile water-now having a 1:100 dilution factor) for up to as many times needed. (Making the ratio 0.1:9.99 dilution)
-
Place the samples into the incubator for 48 hours at 25°c
- Swab the surface-i.e. the bench you are working on, with some form of disinfectant with some cotton wool.
- Wash hands
Pilot test one- ‘Lawn’ test on agar plates
To test to see if the bacteria would grow on the agar plates I need to conduct a pilot study only using full-fat pasteurized milk. I left the milk exposed to the air for a period of 16 hours at room temperature (approximately 27ºc) to allow the bacteria to growth, and then carried out the pilot study using the above method-diluting the milk only once to 10x10¯2 to allow a maximum spread.
Results
The bacteria had not grown. There was a large colony on the diluted milk plate but it is likely to be a contaminant-due to contamination of the experiment-either from the atmosphere or cross contamination. Looking at these results, I will try growing the bacteria on a milk agar plate, along with a titration method.
There are a number of other options that could be considered to allow the bacteria to grow on a surface-for example a nutrient rich source could be added-this provides the bacteria nutrients that it may be lacking-thus encouraging it to grow. I obtained information from the ‘Philip Harris Unilab catalogue’, which outlines the various mediums that the bacteria present in milk will grow on:
- Glucose nutrient agar
- Lactic acid bacteria (MRS) medium (Milk agar)
- Virrio natrigiends medium
Pilot study two-‘Lawn’ test on milk agar plates
Looking at the evidence from the Unilab catalogue, I will use milk-agar as a surface for the bacteria present in milk to grow. Due to the fact that the bacteria didn’t grow on the agar before I need to perform this assay to see if this method would be efficient for counting the amount of colonies present in milk. I decided to compare the full fat pasteurized milk with the semi-skimmed pasteurized milk.
The recipe for the agar plates was obtained from ‘ Philip Harris Unilab catalogue’:
28g ‘‘Oxoid (make) Nutrient Agar’
1 litre of distilled water
50cm³ fresh milk
Method-Suspend the agar in the water and bring to the boil to dissolve completely. Add the milk when the mixture has cooled. Sterilize by autoclaving at 121°c for 15 minutes. This recipe makes 100 plates-one plate contains 10ml of nutrient agar.
Another source for agar could be malt agar. However, I have chosen the milk agar due to the fact it is rich in the sugar lactose, which is the main source of nutrients etc for the bacteria present in milk to use to grow.
The agar must be kept in a tightly closed jar, away from bright light. There are no problems with handling the agar.
Results
Very pleasing results this time-the bacteria has grown on the agar and colonies have formed. However, the colonies are surrounded by lots of bacteria-it would be impossible to count. Using this information, I feel that either the dilutions have to be greater in order to obtain a clear picture of the amount of colonies growing (amount of bacteria present in milk) or a titration could give a clearer picture. The results so far show, that in fact it seems that there is a greater amount of bacteria present in semi-skimmed milk.
Titration of milk-using sodium hydroxide to measure the levels of lactic acid
When the bacteria reproduce, lactic acid is formed. The greater the amount of bacteria present in the milk, the greater amount of lactic acid is produced. By using sodium hydroxide as the base, I can measure the level of lactic acid in milk.
Care must be taken at all times during the investigation due to a series of safety risks posed by the experiments.
Risk Assessment:
The burette must be held at 90° to eye level in order to prevent the meniscus of the sodium hydroxide from angling and therefore producing inaccurate results.
Apparatus
-
Burette-25cm³
- Conical flask x6
- Milk:
- Semi-skimmed pasteurized
- Full fat pasteurized
- Sodium Hydroxide 0.1M-25ml
- Phenolphthalein (indicator) 1%
- White tile
- Measuring cylinder-25ml
Method
-
Place 9cm³ of milk into a conical flask.
- Add 6 drops of phenolphthalein into the milk
- Secure the burette into the stand and place a white tile on the base of the stand.
- Make sure the tap is closed on the burette and place the funnel into the top and fill with Sodium Hydroxide-to the 0 mark (making sure the base of the meniscus lies on the top of the mark)
- Put the conical flask under the burette and slowly allow some of the NaOH drop into the milk, swirling the flask with your other hand.
- When the milk has started to turn pink, then stop.
- Repeat this method three times for each type of milk, and record the amount of NaOH needed to turn the milk pink.
Results:
(Showing each stage of calculation need to find the amount of lactic acid present in the milk)
Moles of lactic acid = moles of the NaOH x amount of NaOH needed to titrate
1000
Mass of lactic acid = Moles of lactic acid x Molar Mass of lactic acid (90g)
All the results were accurate within 0.05cm³ of each other and therefore assume to be reliable. The smaller the amount needed to reach an end-point, the greater the percentage error it can generate, and thus the possibility for human error to influence the results is high.
The results of this pilot study show that the titration method was successful. The results show on average that 2.3cm³of NaOH is need for the milk to reach a light pink colour-the end-point. Therefore, there is 0.0207cm³ of lactic acid present in the milk.
Looking at these methods, I can see that the milk agar and the titration methods worked the best, however the results from the milk agar are hazy and the form of microbiology being used takes a considerably long time. In conclusion, I am going to carry out the investigation of comparing a range of milks and testing the amount of bacteria produced over a period of time using both milk agar microbiology technique and also titration. I am going to focus on the ‘whole pasteurized milk’- (hoping my hypothesis is correct in assuming that the whole milk will have a great amount of lactic acid present)- for the milk agar method and for the titration, I am going to look at a range of four milks: UHT, Whole pasteurized, semi-skimmed pasteurized, and raw milk. To produce a clear reading I will carry out the experiments in the morning and afternoon for a length of five days. By doing this I can see the rate of production of bacteria (lactic acid)-if it increases at a steady rate or if the production occurs in rapid succession.
Problems that arose:
- There is a rapid end-point and is therefore, easy to ‘over shoot’-therefore I need to performed an initial run in order to establish a rough end-point to the experiment, producing a colour that I can compare the continuing trials.
- Due to the viscous consistency of the milk, it proved difficult to accurately measure out the exact amount in the measuring cylinder, I therefore need to use sufficiently accurate equipment to measure out the 9ml of milk. A pipette would be efficient for this.
First experiment-titrating the lactic acid present in the milk with sodium hydroxide
Modified apparatus
-
Burette-25cm³
- Conical flask x12
- Milk:
- Semi-skimmed pasteurized
- Full fat pasteurized
- UHT
- Raw
-
Sodium Hydroxide 0.1M-25cm³
- Phenolphthalein (indicator) 1%
- White tile
- Pipette-10ml
Modified method
I performed an initial run in order to establish a rough end-point to the experiment-this is necessary because there is a rapid end-point and is therefore, easy to ‘over shoot’.
-
Place 9cm³ of milk into a conical flask.
- Add 6 drops of phenolphthalein into the milk
- Secure the burette into the stand and place a white tile on the base of the stand.
- Make sure the tap is closed on the burette and place the funnel into the top and fill with Sodium Hydroxide-to the 0 mark (making sure the base of the meniscus lies on the top of the mark)
- Put the conical flask under the burette and slowly allow some of the NaOH drop into the milk, swirling the flask with your other hand.
- When the milk has started to turn pink, then stop.
- Repeat this method three times for each type of milk, and record the amount of NaOH needed to turn the milk pink.
Results:
(The results are recorded here as a summary table, you can find the raw results in the appendix)
(Graph overleaf)
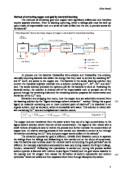
Analysis of the results
The results show a number of conclusions. To begin with, the raw milk seems to have proved my hypothesis accurately. The levels of lactic acid started at 0.0225cm³ and rose in a relatively steady rate up to a level of 0.0270cm³ after just five hours of exposure to room temperature. It then leveled out at this amount for a further 20 hours. These results suggest that the first stage of growth was happening- the lag phase-the cells are active but there is little growth as they are taking up water and starting to produce enzymes. The next phase of growth is outlined after 25 hours of exposure-the exponential (or log phase)-the population increases rapidly-from just 0.0207cm³ of lactic acid present in the milk, to 0.0585cm³-a total increase of 0.0378cm³ in just 25 hours. Surprisingly it seems the bacteria endure another lag phase-the cells are still active but again there is little growth. Without looking at the results following these, you might assume that the bacteria are progressing towards the stationary phase-bacterial cells are dying more or less at the same rate, as they were produced-however looking at the results at 75hours-80hours it seems that this stage is highlighted here. After 50 hours the levels of lactic acid, production seems to decrease-only a slight increase of lactic acid content-from 0.0585cm³ – 0.0801cm³ (an increase of 0.0216cm³). If you compare this to the increase of lactic acid content from a similar time difference there is an obvious decline in production, for example between 25 hours and 30 hours there is an increase of content of 0.00450cm³-almost double the rate of production. Finally, the levels of lactic acid after 55hours suggest that the bacteria are now progressing through the second exponential phase (log phase)-an increase from 0.0630cm³ to 0.0801cm³ in just 20 hours. The last part of the graph suggests the bacteria are now at the death phase-no more lactic acid is being produced, seeming that the population are encountering limitation factors in the form of nutrient depletion. Therefore, more cells are dying than being produced, the population then declining. However, this cannot be a certain statement as the experiment only ran for 5 days and the levels seem to be rising again. As you can see from my results, I ended the experiment of measuring the lactic acid content in raw milk after just 80 hours. This was due to the fact that the milk had started to separate as such-a viscous white mass had formed on the surface of the milk-with a translucent liquid underneath. My research later shows the reason for this.
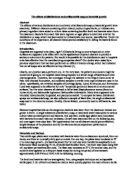
Initially, the amount of lactic acid produced is very similar between semi-skimmed and whole pasteurized; both have undergone the process of pasteurization. However, after the 30hour point the whole milk lactic acid content vastly outruns that of the semi-skimmed-following the pattern of the raw milk-but with slightly lesser amounts of lactic acid. The whole milk shows the same stages of processes starting with the lag phases, and then progressing into the exponential (or log phase) after 25hours. Again, there seemed to be a second lag phase after 50hours. Surprisingly, after 55-75hours the lactic acid content actually declines-lactic acid amount of 0.972ml (from 0.0576cm³ to 0.0468cm³). Again, unexpectedly, the lactic acid content climbs again dramatically-from 0.0468cm³ to 0.0720cm³ (difference of 0.0252cm³). This result could suggest a problem with the titration-either human error or an error with the equipment. This seems unlikely, however, due to the fact that a series of runs were made-all showing exactly the same amount of sodium hydroxide needed to titrate the milk. A similar pattern is shown with the UHT milk and the semi-skimmed, each time the amount of lactic acid present in the milk declines and rapidly rises again-only the UHT milk and the semi-skimmed milk at the same hour though (75-80 hours of exposure). If the experiment with the raw milk continued-the same pattern may have emerged.
I decided to calculate the gradients of the lines of best fit to see the increase difference between the milks. To calculate the gradient I have to use this equation: y/x the results are as follows:
This calculation shows that there is a difference of 4.25 x10⁻⁴ between Raw milk and Whole pasteurized milk. The difference between the Whole milk and the Semi-skimmed is 0.93 x 10⁻⁴ (or 9.30 x10⁻⁵). The difference between the Semi-skimmed pasteurized, milk and the UHT milk is 0.65 x10⁻⁴ (or 6.50 x10⁻⁵). This shows there seems to be a declining amount of difference between the lactic acid content in the milks-the Raw milk obviously with the highest gradient. Using this information I could work out the general rule for this graph to suggest the difference between the gradients, but I do not feel this is necessary, as it could not possibly be used to estimate a different type of milk.
The graph shows that there seems to be a trend in the overall pattern of increase of lactic acid, between the UHT milk, the Whole milk and the Semi-skimmed. The second acetate layer of the graph highlights this-however this is a very general ‘line of best fit’ and a firm conclusion can no be made from it.
The error bars on the graph are quite close together, which shows that the results are fairly accurate. The larger error bars occur at the time of 75 hours- the semi-skimmed milk, an error bar of 0.0223cm³ of lactic acid present-and thus it was at these times that the greatest errors in data collection occurred. This was probably due to the fact that human error can change the results so easily, along with faulty apparatus (different apparatus was used each day-therefore, it could be possible that the results were not entirely accurate). To enable me to compare the difference in the results obtained, I could calculate the percentage errors of each experiment using the following equation:
% error = largest value-smallest value
mean value
When the error bars on the graph are compared with the lines of best fit I can see that the points are a long way off the line-suggesting that possibly the accuracy of the experiment was not totally precise. For example, the line of best fit runs through 0.0525g whereas the point on the first graph runs at 0.0540g.
Conclusion of the results
Looking at my results it seems that my hypothesis was correct to some degree-‘fresh pasteurized milk will contain a higher number of bacteria than the newly opened UHT milk and the pasteurized milk will spoil at a faster rate than the UHT milk. The raw milk will have the higher amount of bacteria present at all times.’ Indeed it seems that the bacterial content notably increased as the period of time the milk was left exposed to room temperature increased, it also shows that the raw milk did certainly have the highest bacterial content. However, the semi-skimmed showed the highest content at the 75hour mark (this could have been due to human error or an imbalance of variables).
As I noted before the milk and dairy products, with their high nutritional value and the presence of easily usable carbohydrates, fats, and proteins, are ideal environments for spoilage by microorganisms. Unpasteurized milk undergoes a predictable four-step succession during spoilage: Acid production by Lactococcus lactis subsp. Lactis is followed by additional acid production associated with the growth of more acid tolerant organisms such as Lactobacills. At the point yeasts and molds become dominant, degrade, and accumulated lactic acid, and the acidity gradually decreases. Eventually protein-digesting bacteria became active, resulting in a putrid odor and bitter flavour. The milk, originally opaque, can eventually become clear.
Using the above information I can distinguish why the lactic acid levels appear to be reducing-which would seem like an absurd result ordinarily. Focusing on the last two sentences of the above information-‘additional acid production associated with the growth of more acid tolerant organisms such as Lactobacills. At the point yeasts and molds become dominant, degrade, and accumulated lactic acid, and the acidity gradually decreases. Eventually protein-digesting bacteria became active…’- shows that the reason why the amount of lactic acid decreases at the end of the experiments in the whole pasteurized milk and the semi-skimmed pasteurized milk is likely to be attributable to the point yeasts and molds are becoming dominant and accumulating the lactic acid. After 75hours the levels of lactic acid present in the whole pasteurized milk seem to decrease-again showing this stage of yeast and molds gathering the lactic acid and using it to reproduce. However, the difference here is that the levels appear to increase again. This could be due to the fact that the bacteria growing to begin with stopped reproducing due to the high lactic acid levels (they were being killed off), if the levels then drop then the bacteria can start to reproduce again and as anticipated the levels of lactic acid will climb again. This suggests a continuous cycle of growth similar to that of negative feedback. This pattern can also be seen very clearly in the UHT milk-after 80hours the levels drop from 0.0495cm³at 75hours down to 0.0270cm³ (a fall of 0.0225cm³). The levels then rise up to 0.0450cm³ after 105hours.
(If you refer back to the third layer of the graph, you can clearly see the stages of growth in each milk-I have sectioned off each area)
Note: I decided to draw out three layers to this graph so a clear conclusion can be made from the results-the first raw graph shows the patterns that I have been analyzing in my investigation, the second layer is a line of best fit so that I can visualize the general increase of the milks-noting any patterns that can be found and the gradient amounts. And finally, the third layer shows the different stages of growth in each milk-for example where the death phase appears.
Second experiment-culturing the milk on milk agar
Final apparatus-culturing bacteria
- Alcohol-ethanol-50ml of 1M
- Bunsen Burner
- Smearing glass rod
- Milk agar plates
- Sterile water-9.99 concentrating
-
Incubator- 25°c
- Pipette-1cm³
- Disinfectant
- Cotton wool
- Sellotape
- Pen
- Heat proof mat
- Agar covered petri dish
The recipe for the agar plates was obtained from ‘ Philip Harris Unilab catalogue’ :
28g ‘‘Oxoid (make) Nutrient Agar’
1 litre of distilled water
Method- suspend the agar in the water and bring to the boil to dissolve completely. Sterilize by autoclaving at 121°c for 15 minutes.
This recipe makes 100 plates-one plate contains 10ml of nutrient agar.
Final method
- Wash hands
- Prepare the surface-i.e. the bench you are working on, with some form of disinfectant with some cotton wool.
-
Take 0.1cm³of the milk and place the amount on the surface of the agar plate without taking the lid off fully-to reduce the amount of air the agar/bacteria is exposed to.
- Replace the lid and take the glass rod and dip it in the ethanol and immediately place it over the Bunsen burner to disinfect the rod, repeat a couple of times.
- Again, without taking the lid off fully, slide the rod into the plate and smear the milk around to give a consistent and full covering over the agar plate.
- Replace lid and sellotape the edge-not covering the whole plate as to allow air to still reach the bacteria.
- Never open a sealed petri dish
- Label the plate.
- Repeat the procedure, but with diluting the milk:
-
Take 0.1cm³ of the milk, unscrew the lid of the sterile water bottle, and hold the opening of it in the flame for 2 seconds. Place the milk sample in the jar of the 9.99 sterile water concentration.
-
Replace the lid and shake. Again heat the entrance of the jar and take 0.1 cm³ of the mixture (now being 1: 10 dilution factor)
- Repeat the method of the smearing and seal the jar.
-
Repeat the dilution of the milk in the sterile water (taking a 0.1 cm³ sample from the 1:10 and placing it in another jar of 9.99 sterile water-now having a 1:100 dilution factor) for up to as many times needed.
-
Place the samples into the incubator for 96 hours at 25°c
- Swab the surface-i.e. the bench you are working on, with some form of disinfectant with some cotton wool.
- Wash hands
Results
There were a number of problems with this particular experiment. To begin with, the time that the plates were left incubated, I suspect, should have been shortened-there was a large covering on the plates and it was impossible to count every individual colony. I realized before I carried out this experiment that a serious of dilutions would have to be made in order to produce much smaller amounts of colonies-I took this information on board and carried out a different series of dilutions for each day-taking into account that the levels of bacteria should be increasing. For example:
Despite this plan, the colonies were still too plentiful to count and due to the limitations of the schools equipment I was unable to dilute any further down the scale (there was no other available method of counting the bacteria either). In spite of this, I could still use the results from the experiment to justify that the bacterial levels were indeed increasing. Without the actual numbers of bacterial colonies I could still use the mass amounts of colonies to note the increase-for example when I compared the raw milk with a dilution of 10-6 on the first day with the raw milk with dilution factor 10-6 on the second day the amount had nearly doubled. Therefore, this experiment helped me visualize the bacterial growth and has also told me which bacterium was present in this milk. Identification of the bacteria present in the milk can be made due to the specialization of the medium the bacteria is grown on. For example, milk agar contains lactose-the sugar present in milk. ‘Lactobacillus bulgaricus’ will only grow on this medium-therefore the growth on the milk agar medium suggests that this bacteria was present. Without this lactose in the medium, the bacteria will not grow-so eliminating a certain medium would show what bacteria was there.
If I were to repeat this experiment again I would take greater care into planning the length of time the plates were left incubated, this would include making a series of preliminary tests to judge at which temperature and the length of time the bacteria is exposed to it for would be best. However, it would still be difficult to count the bacterial colonies. Further research into the methods could provide a better surface for the bacteria to grow on-possibly with some sort of indicator or highlighter.
In general I believe that the two experiments together show a clear and concise conclusion that reflected well on my hypothesis. The raw milk obviously had the highest content of bacteria present throughout the experiment, the whole milk next with the second highest amount and then the semi-skimmed milk and finally the UHT milk with the lowest amount. The pasteurization process must be the cause of this decline in amount of bacteria, also the fat content. Overall I am very pleased with the standard of work that I have produced and the outcome of my experiment, I have learnt may skills and the area has greatly interested me.
Further investigations: Milk tests
I carried out a further investigation in order to find out if the process of pasteurization was the cause of the ‘longer shelf life’. I replicated the conditions that the milk goes through-however the experiment was inevitably going to be of amateur quality.
Experiment to investigate the relationship between bacterial content and pasteurization
Apparatus
-
Burette-25cm³
- Conical flask x6
- Milk:
-
Sodium Hydroxide 0.1M-25 cm³
- Phenolphthalein (indicator) 1%
- White tile
-
Measuring cylinder-25 cm³
- Bowl of ice
- Bunsen burner
- Tripod
- Gauze
- Stop watch
- Beaker
- Thermometer
- Glass rod
Method
The burette must be held at 90° to eye level in order to prevent the meniscus of the sodium hydroxide from angling and therefore producing inaccurate results.
I performed an initial run in order to establish a rough end-point to the experiment-this is necessary because there is a rapid end-point and is therefore, easy to ‘over shoot’.
- Set the tripod and gauze up with the Bunsen burner underneath and light to a blue flame.
- Heat the milk for one minute-stirring continuously with the glass rod to prevent the milk burning
-
If the milk starts to boil reduce the heat-do not let the milk exceed 75°c
-
Remove a sample of 9 cm³ of milk and place in a conical flask
- Immediately submerge the flask in the bowl of ice-for 2 minutes
- Keep a thermometer in the bowl of ice to ensure the temperature remains below the minimum temperature of 0°c
- Add 6 drops of Phenolphthalein into the sample
- Secure the burette into the stand and place a white tile on the base of the stand.
- Make sure the tap is closed on the burette and place the funnel into the top and fill with Sodium Hydroxide-to the 0 mark (making sure the base of the meniscus lies on the top of the mark)
- Put the conical flask under the burette and slowly allow some of the NaOH drop into the milk, swirling the flask with your other hand.
- When the milk has started to turn pink, then stop.
Repeat this method three times for each set of samples, and record the amount of NaOH needed to turn the milk pink.
- For the second sample heat the milk and remove from the heat after 2 minutes, and for the next sample remove after 3 minutes etc
Results
(The full results can be found in the appendix)
Cooled for 1 minute
Cooled for 2 minutes
(Graph overleaf)
Analysis of results
The results of this experiment show a very crude relationship between the bacterial content and the process of pasteurization. As the temperature increase and the time that the milk is exposed to the high temperatures the bacterial content decreases. It also seems that the longer the milk is cooled the higher the bacterial content. Therefore, the process of pasteurization must be very vigilant-the milk must be heated quickly to high temperatures (but not too high as this decrease the vitamin content in the milk) and cooled only for a short period of time. Looking at the information I obtained about the pasteurization process I decided to not exceed the temperature of 75ºc-if the temperature did surpass this then vitamins etc in the milk will be lost and damage will be done to the structure of the milk making it inconsumable. However, the results may not be accurate due to variables such as human error, loss of heat to the surroundings and the increasing temperature of the ice (if heated milk is continuously placed in the ice then the temperature will increase). The lowest bacteria content in the milk was at 8 minutes, previously cooled for only 2 minutes, the result being only 0.00657 cm³ of lactic acid.
This experiment could be used to produce laboratory prepared pasteurized milk-milk that will have been controlled for the experiment and the pasteurization process would have been the only process applied to the milk. For example, it is likely that the commercially made milk that was bought for the experiment experienced a number of additional procedures to make the milk ‘last longer’. Therefore, if this crude experiment were to be perfected and refined then the method could be used as an additional control to produce highly accurate results for this investigation. However, the results were sufficient to answer the question; does pasteurization directly account for the lower concentration of bacteria within the milk? It seems it does.
Other ways of testing the lactic acid content of the milk could be to test the pH of the milk over a set of hours. Obviously, as the rate of bacteria reproduction increases, then so too does the waste products (the lactic acid). Therefore, you would be testing the acidity levels of the milk. An a number of methods are available to do this, here are just a few that could be considered:
Litmus Milk Medium
Litmus is a indicator-colouring material (obtained from lichens) that turns red in acid solutions and blue in alkaline solutions; used as a very rough acid-base indicator. Litmus is a multi-purposed and sometimes confusing medium because there are many reactions that you can get with it. It is the same indicator that is used with pink litmus and blue litmus papers in a chemistry lab to test whether a solution is acid or base. It starts out as a light lavender colour. The 2 nutrients in milk are casein protein and lactose sugar. A bacterium can use one of these, both of these, or neither of these, hence a variety of end results.
If a bacterial species, which ferments glucose but not lactose, is inoculated in litmus milk, the litmus may turn pink due to the acid formed from the trace of glucose. The colour change will not be great and may only be detectable by comparison to an uninoculated tube of the same lot of litmus milk incubated with the inoculated tubes. If the bacterium is able to produce alkaline products from either protein, usually the lactalbumen, the colour will change back to lavender or even blue. If the bacterium is able to ferment lactose, a deep, permanent, red colour is produced due to the large amount of lactose in milk. Rarely, does the bacterium produce enough alkaline substances to reverse the deep red colour to pink, lavender, or blue.
Another similar example of this method would be ‘Ulrich Milk’-this includes using Methylene blue and Phenol red as the indicators. This medium works exactly like Litmus Milk but is more dependable and probably cheaper. Colours differ from Litmus Milk. Phenol red is red at alkaline pH. Phenol red is yellow at acid pH. Oxidized methylene blue is blue. Reduced methylene blue is colourless. Recall red plus blue is purple.
The HMB System
BioTech's patented HMB System replaces traditional aerobic plate count methods with faster, more accurate, testing procedures for measuring bacterial and fungal populations. Able to serve as a primary testing device, an early warning system or as a quality control tool, the HMB is packaged as an easy-to-use, inexpensive, patented instrument that uses disposable test kits. The HMB System requires no extensive or costly training, and is less expensive to use than other microbial testing technologies. The result is a test procedure that can be used by employees who have little or no scientific background. By combining speed and economy, the HMB System brings new cost effectiveness to testing procedures. It makes possible more frequent testing and enhances product quality by making Fluid Quality Control an integral part of production procedures.
Other methods of growing bacteria on a growth medium:
The Relationship of Identification to Bacterial Classification and Nomenclature
In order to identify an unknown bacterial isolate, the characteristics of the isolate must be compared to known taxa (classification of organisms into groups based on similarities of structure or origin). In microbiology, the basic taxonomic unit is the species, and groups of related species are placed in the same genus. However, the term "species" does not have quite the same meaning in bacteriology as it does in the classification of plants and animals. In the latter cases, species are rigorously defined on the basis of individuals' capacity for interbreeding and geographical isolation. No such absolute tests are possible with asexual, globally-distributed bacterial strains.
Thus bacterial species are defined operationally - they are collections of similar strains. Classification schemes contain the criteria whereby the characteristics used to distinguish one species from other related ones are presented There is no "official" classification of bacteria, but reference sources such as Bergey's Manual of Determinative Bacteriology and Bergey's Manual of Systematic Bacteriology
are the most commonly used resources in microbiology.
The identification of unknown cultures is a practical application of a classification scheme, so that a new isolate can be recognized as a member of an existing species. Microbiologists must identify bacterial isolates for several practical reasons:
-
Medical diagnostics: Identifying a pathogen isolated from a patient.
-
Food industry: Identifying a microbial contaminant responsible for food spoilage.
-
Research setting: Identifying a new isolate which carries out an important process.
Whilst searching on the internet I came across a developed technique for counting the growth colonies developed on agar plates. The Indiana Department of Environmental Management (IDEM) make sure that all NPDES must conduct E. coli testing on water. The new method (Coliscan MF Method) was compared with an older method called the m-TEC Method. The results for the test are as followed:
Advantages of the Coliscan® MF method are numerous.
1. There is no initial 2 hour resuscitation period requiring operator attention and a change of incubators, as well as the placement of the plates in waterproof bags for the water bath incubator.
2. Temperature is not critical. 24 hr incubation at 35ºC ±0.5 is the only requirement. Less time is used in checking and calibrating incubators and no switching from incubator to incubator is needed. (Also, much less expensive incubators can be used.
3. There is no need to do the additional urease test required by the m-TEC method. This saves time and expense. Also, some bacterial types (eg. Pseudomonas spp. ) can result in gross false positive results with the m-TEC method.
4. Coliscan® MF broth is easier to use and plates are easier to prepare than m-TEC agar medium, which must be mixed, sterilized and dispensed into plates, and then stored until use. The Coliscan® MF broth is kept frozen (with a 6 month shelf life) until needed and then the thawed broth is dispensed aseptically into plates containing sterile absorbent pads and fresh medium is assured.
5. Coliscan® MF broth is provided in safe-to-use plastic bottles (20 mL for 10 tests/bottle) which are recyclable. There are no dangerous-to-handle glass vials to break open.
6. Coliscan® MF medium is based upon well proven technology which incorporates chromogenic enzyme substrates. It is superior to the modified m-TEC medium developed by the EPA laboratories which uses only one chromogenic substrate (for the enzyme glucuronidase) and requires the resuscitation period followed by elevated incubation temperature.
By taking the ideas of the experiments, an investigation could be made to see if the method could be copied and applied to other testing areas-e.g. testing milk from a particular cow for contamination by means of harmful bacteria etc. this method seems much more reliable and easier to distinguish the colonies that have grown on the plate-due to inaccuracy present in my initial experiment (counting the bacterial colonies on the milk-agar) a better method such as this could also add control to produce highly accurate results for this investigation.
Appendix
All results correct to 3 significant figures
Results of the ‘titrating the lactic acid present in the milk with sodium hydroxide’ (modified experiment (final results):
Hours exposed to the air: 0
Hours exposed to the air: 5
Hours exposed to the air: 25
Hours exposed to the air: 30
Hours exposed to the air: 50
Hours exposed to the air: 55
Hours exposed to the air: 75
Hours exposed to the air: 80
Hours exposed to the air: 100
Hours exposed to the air: 105
Results-amount of lactic acid present in the milk
Hours exposed to the air: 0
Hours exposed to the air: 5
Hours exposed to the air: 25
Hours exposed to the air: 30
Hours exposed to the air: 50
Hours exposed to the air: 55
Hours exposed to the air: 75
Hours exposed to the air: 80
Hours exposed to the air: 100
Hours exposed to the air: 105
Results of ‘experiment to investigate the relationship between bacterial content and pasteurization’
Cooled for 1 minute
Cooled for 1 minute
Cooled for 2 minutes
Cooled for 2 minutes