~ The same temperature (18o room temperature) will be used for each experiment because enzymes cannot work effectively in extreme temperatures.
~ I will carry out each experiment three times to find the average so that my results are reliable.
~ In a previous experiment I tested hydro peroxide with boiled and raw liver, and found 20ml a good amount of hydro peroxide. I will use this amount again because much more caused an overflow, and much less didn’t have enough of a reaction to record.
~ I also found 1gram of raw liver a good amount to give an effective quantity of froth
~ 4cm3 of buffer is a good amount as it is sufficient to change the pH of the hydro peroxide.
Equipment: ~ Liver, cut into 1gram squares (use liver as it has a large amount of catalase)
~ Hydrogen peroxide
~ Hydrochloric acid (pH1)
~ pH 4 buffer
~ Distilled water (pH7)
~ pH 9 buffer
~ Sodium Hydroxide (ph14)
~ Pipette
~ Measuring cylinder
~ Scales
~ Weighing boat
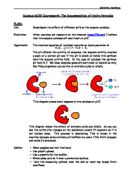
Diagram:
Method: ~ Using a weighing boat measure 1 gram of liver in a square shape using a knife on a board.
~ Measure 20ml of hydro peroxide into a measuring cylinder.
~ To this add 4cm3 of buffer (vary pH) using a pipette.
~ The reaction will take place; measure the height of froth in cm and record results
___________________________________________________________Christina Hardinge
Results:
Try 1
Try 2
Try 3
Average:
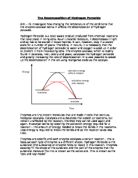
As you can see from both the table and graphs, pH 7 creates the most amount of froth and thus the optimum pH level for catalase is 7. However rather than rising to pH 7 and then falling at the same rate again, the results fall at pH 9 and then slowly rise at pH 14. I didn’t expect this because my hypothesis shows that the catalase is mainly denaturized at the extreme acids and alkalis, pH 1 and pH 14.
CONCLUSION:
My results support my prediction and show catalase is most reactive at pH 7 as it has shown more froth than others, and thus is the optimum pH for catalase.
FLAWS IN THE METHOD:
~On a few occasions the froth overflowed from my measuring cylinder, and to have prevented this from happening I should have used a taller measuring cylinder or decreased the volume of hydro peroxide.
~It was very difficult to achieve the exact same shape and weight of the liver each time which means there would have been a different amount of catalase each time. Also it means there was not always the same amount of surface area exposed, which could affect the number of collisions. This is because a catalyst works by giving the reacting particles a surface to stick to where they can bump into each other. Therefore, if there is a larger surface area for the particles to stick to there will be more collisions
~When I first began the experiment I used fresh liver, however I used the same liver when I resumed with the experiment four days later. There could have been a change in the catalase in the liver throughout the four days.
~As I continued the experiment four days later, the room temperature could have easily changed.
~It could have affected the results if any cylinders or pipettes had not been cleaned between each experiment, and so traces of buffer could have accidentally been used in another experiment.
___________________________________________________________Christina Hardinge
A PREVIOUS EXPERIMENT:
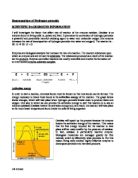
Prediction: I believe that the raw substances with create a froth, whereas the boiled substances will not because the enzymes where killed when boiled.
Method: In a measuring cylinder add 20ml of hydro peroxide, and then add a 1 gram square piece one of the following; raw carrot, boiled carrot, raw potato, boiled potato, raw liver and boiled liver. Record the results
Diagram:
Results:
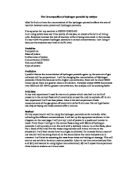
~As you can see my prediction was correct. There was no froth for the boiled substances, and this is because there is no catalase to break the hydro peroxide down into water and oxygen (froth).
~My results also show that liver is the most reactive as it created the most froth, and thus has the most catalase. This is one reason why I chose liver for my other experiment.
___________________________________________________________Christina Hardinge
ANALYSIS:
Catalase works best at pH 7 as it creates more froth, and thus more oxygen and water. The highest amount of froth was 57ml on average.
~ pH 1 had the least amount of froth, 4.6 ml on average, wasn’t very reactive and thus denatured the most.
~ pH 4’s activity increased and had 25ml of froth on average.
~ pH7 had the highest result, 57 ml on average, and therefore the optimum pH level for catalase
~ pH 9 began to decrease and had an average of 32 ml of froth
~ pH 14 surprisingly increased, and had an average result of 39.6 ml.
EVALUATION:
Overall, I am pleased with my method as I was able to achieve a height of froth measurable, that it was a fair test and that my results are as I predicted.
My evidence is reliable as I tested each experiment three times to find the average which meant my results were more dependable. The only anomaly I experienced was that for the end results the activity increased at pH 14 rather than decrease (I commented on this in my results). Reasons for this could have been my equipment was dirty, the liver could have been fresher for this experiment, the hydro peroxide could have been stronger or fresher, and also it was extremely hard to maintain the same shape and weight of the liver used.
To improve these faults I could begin and finish the experiment all on the same day, as room temperature and the freshness of the liver could change within days, I could clean my equipment more thoroughly or use new
equipment for each test, and I could have used other pH values for a more accurate result. For example I could have tested pH 10, 11 and 12 to find out exactly when the results begin to fall and rise again.