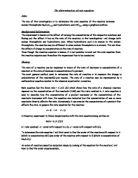
Concentration-time graph for zero-order reaction
Rate-concentration graph for zero-order reaction
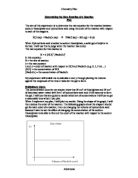
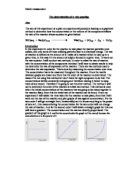
First- and second-orders reactions give curves when plotting the data on a concentration-time graph, but the second order curve is deeper than the first order. For a first-order reaction, the rate of reaction is directly proportional to the concentration of one of the reactants. For a second-order reaction, the rate of reaction is directly proportional to the square of the concentration of one of the reactants.
Concentration-time graph for the first order reaction
Rate-concentration graph for the first order reaction
Concentration-time graph for the second order reaction
Rate-concentration graph for the second order reaction
Fair test:
All of these variables (including the controlled variables) will need to be controlled by the person, and to be kept the same throughout the experiment in order to keep it fair and get as accurate results as possible. Only the independent variable is changed.
Variables:
- Independent variable: concentrations of hydrochloric acid and sodium thiosulphate
- Dependent variable: time taken for the reaction to occur completely
- Controlled variables:
- Temperature will be controlled with a thermometer and has to be kept at room temperature as it would affect the rate of reaction.
- Total volume of solutions for each, hydrochloric acid solution and the sodium thiosulphate solution, has to be kept constant.
- Pressure in the room has to be kept constant otherwise it will alter the rate of reaction.
Risk assessment (4):
- hydrochloric acid is irritant and irritating to the respiratory system
- Wear your hair tied back
- When something is spoiled it should be rinsed up immediately
- sodium thiosulphate has a low hazard
- sulphur has a low hazard
- sulphur dioxide is toxic and inhalation of sulphur dioxide can cause breathing difficulties such as asthma
- Wear goggles all the time
Apparatus list (for one investigation only excludes repeats):
Table to show reasons for choice of apparatus:
Sketch:
Method:
When varying the concentration of hydrochloric acid:
- Collect apparatus as shown in the sketch above
-
Using the serial dilution table, make up the hydrochloric acid solution of 2.0 moldm-3 for experiment number 1 using the 25ml measuring cylinder
-
Make up the solution of sodium thiosulphate of 0.4 moldm-3 for experiment number 1using the 100ml measuring cylinder using 65cm3
- Mix both liquids together into the 100ml conical flask
- Start the stop watch immediately after mixing both liquids together
- Swirl the conical flask with its contents
- When the solution turns cloudy and the cross is not visible from above the conical flask anymore- stop timing
- Repeat steps 1-7 for the different concentrations of hydrochloric acid while keeping the concentration and volume of sodium thiosulphate constant
- Repeat the whole experiment three times to exclude anomalies
- Write down the results into the results table
Results table to show find the order of reaction for hydrochloric acid and sodium thiosulphate
- Plot the results for hydrochloric acid in a concentration-time graph and compare your results with the graphs shown in the background theory. When you can identify a zero-order you can accept that, but if you identify a first- or second-order you have to carry on.
- Calculate the rate (1/t) for each concentration
- Plot the results: rate(y-axis) against concentration(x-axis)
- Deduce order of reaction from the resulting graph using previous knowledge from background theory and put your constant for a into the rate equation.
-
Rate= k [HCl(aq)]a
When varying the concentration of sodium thiosulphate:
Use the same method as when varying the concentration of sodium thiosulphate. Use a 200ml conical flask instead and keep the hydrochloric acid concentration constant using 45cm3 only. Deduce the order of reaction from the resulting graph and put your result into the rate equation: Rate= k[Na2S2O3(aq)]b
Dilution tables:
Serial dilution table for sodium thiosulphate:
Serial dilution table for hydrochloric acid:
When varying the concentration of Hydrochloric acid:
-
Concentration (moldm-3) = (moles/volume (dm3))
2= (moles/0.025)
Moles=0.05 it is a 2:1 ratio, so moles for sodium thiosulphate: 0.025
- 0.4=(0.025/volume)
Volume=0.0625 dm3
Volume=62.5cm3
use 65cm3 of sodium thiosulphate in excess when varying the concentration of hydrochloric acid.
When varying the concentration of Sodium thiosulphate:
0.4=(moles/0.1)
Moles=0.04 as it is a 2:1 ratio for hydrochloric acid, so moles for hydrochloric acid: 0.08
2=(0.08/volume)
Volume=0.04dm3
Volume=40cm3
Use 45cm3 of hydrochloric acid when varying the concentration of sodium thiosulphate.
Bibliography:
- Essential A2 Chemistry for OCR by Ted Lister and Janet Renshaw, page 98-105
- Chemistry A2 endorsed by OCR, page 108-109
- AS Chemistry by Andrew Hunt,page 114-115
- Hazcard references from the school laboratory
- Class notes
References are marked as numbers in brackets, for example (3) which means number 3 in the bibliography.