The 12 lead E.C.G provides an E.C.G trace where the graph paper is separated into 1 mm squares on the horizontal axis, and this is equivalent to 0.04 seconds and 5 mm squares which is equivalent to 0.20 seconds, the standard paper speed is 25 mm per second and by measuring the PR interval and the QT interval and QRS duration is the way that the electrical activity of the heart can be determined, i.e. heart diagnosis. The horizontal line on the trace is called the baseline and it is this point on the trace paper where a variety of measurements can be taken and it is these measurements that can detect heart diseases in a patient.
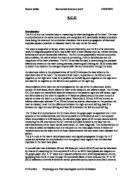
The S.A node is the hearts natural pacemaker and signals propagates through the A.V nodes and activates the ventricles and it is throughout these regions that the electrical impulses in the heart take place
A normal heart rate is between 60 and 100 beats per minute (B.M.P) and can be estimated by means of measuring the 5mm squares R to R on an ECG trace (please see diagram on the graph paper (2)). A ‘P’ wave is an upward deflection and atrial depolarisation occurs, spreading from the S.A node through the contractile fibres in both atria and the ‘P’ to ‘R’ (ECG deflection) interval is where an action potential occurs; sodium ions (Na+) move to inside the neuron, these stimuli cause the membrane to depolarise. A normal ‘P’ to ‘R’ interval lasts between 0.12 and 0.20 seconds and within this time the completion of atria depolarisation which originates from the sinoatrial (S.A) node and this electrical current travels down through heart via the atrioventricular (A.V) node, the bundle of his and bundle branches to the ventricular and the ‘P’ alone represents the time span it takes for the atria to depolarise. The ‘Q’ to ‘T’ interval is the beginning of the ‘QRS’ complex, which starts with a downward deflection and is triangular shaped starting at the Q position and ending at the S position and this represents the time it takes for the ventricular cells to depolarise. It is at this point that a rapid ventricular depolarisation occurs because an action potential takes place through contractile fibres, i.e. an increase in sodium ions inside the cell inside the cell is now positive and the threshold has been reached. The ‘T’ ECG defection represents the ventricular repolarisation, which follows after the ventricular has depolarised. The Potassium (K+) ion channel inside the membrane opens and K+ flood out of the cell it is at this point that electrical balance is restored. The ‘ST’ segment on an ECG is electrically neutral; also a ‘U’ wave ECG defection sometimes may be seen on an ECG trace after a ‘T’ wave and it is believed that this may represent a late repolarisation of the Purkinje fibres, which are situated in the ventricles.
Some patients can develop chest pains within the first 2 minutes or so of exercise, the extra workload on the heart is measured by metabolic equivalents (METs).
A diagnostic for ECG exercise-achieved testing is arrhythmia irritation and/or where a patient complains of symptoms, such as sudden chest pains.
“ After only 2 minutes and 24 seconds of exercise (according to Bruce protocol), the patient developed chest pain and electrocardiography showed marked ischaemic changes (maximum 3 mm ST segment depression in lead V6)”. BMJ 2003;326:1027-1030 ( 10 May )
Clinical review ABC of interventional cardiology.
The changes during exercise in a ‘normal’ ECG trace show the measurements of the ‘P’ wave increases in height and the measurements of the ‘T’ and ‘R’ wave decreases, the ‘J’ point becomes depressed and the ‘Q – T’ interval is shorter also ‘S - T’ segments are sharply up slopping.
When the ‘S-T’ segment is depressed by 1 mm i.e. a very slight up slopping, it could indicate myocardial ischemia. An abnormal blood pressure reading and a reduced exercise capacity are likely to suggest an unfortunate prognosis and are likely to confirm the patient is suffering from some sort of coronary disease.
Blood pressure is taken and recorded before and after the first stage of the exercise and at the end of the exercise test. The systolic measured blood pressure should show an increase in the period of time exercise takes place and the diastolic should decrease slightly, this ensures that the blood is travelling around the heart correctly.
“Abnormal changes during exercise. The standard criterion for an abnormal ST segment response is horizontal (planar) or down sloping depression of >1 mm. If 0.5 mm of depression is taken as the standard, the sensitivity of the test increases and the specificity decreases (vice versa if 2 mm of depression is selected as the standard).” Exercise tolerance testing Jonathan Hill, Adam Timmis.
Minor degree of cardiac axis deviation could reveal many anatomical variations such as pregnancy additionally wide ranges of normalities are taken into consideration when measuring the cardiac axis this being –30 0 to +110 0 also the left axis deviation is –30 0 whereas the right axis deviation is +110 0 also certain symptoms and abnormalities in the heart can be detected via measuring the cardiac axis. When electrodes III and II are negative but electrode 1 is positive then the axis deviation is said to be to the left and this could detect left anterior hemiblock and if the deviation is to the right axis this could illustrate hypertrophy of the right ventricle, particularly shows when electrode 1 is negative but electrode II and III are positive. The cardiac axis position lies away from the electrodes in which it is most negative.
Results
The cardiac axis which is a geometric method where the height of the R wave (marked 1* on the ECG trace) was measured (please see diagram) from the ECG trace (lead 1 from the VLP), this gave a measurement of 12 cm this was then multiplied by 3 (arbitrary number) this measurement was then transferred to the 60o line (which represents mark 2*) measuring from the centre towards the point of the arrow. Another measurement was taken from the AVR isoelectric line (baseline) to the ‘R’ peak which was measured to be 6 cm this was again multiplied by 3 (arbitrary number) this was then transferred to the 30 o line, measuring from the centre AWAY from the point of the arrow. These 2 lines were then projected onto the circle of axis and a line was then drawn from the centre of the circle of axis to the intersection of the 2 lines. This gave and axis of approximately 89 0. This was repeated for the cardiac axis number 2 this was also worked out and gave 930. Therefore it was determined that the axis for this ECG trace is 89 + 93 =182, 182/2 = 91 (or equals an amount between 890 – 93 0).
Discussion
The subjects were not known to suffer or had suffered from any heart abnormalities however this was not confirmed. During exercise the body is moving i.e. when walking or running on a treadmill therefore it is quite possible this movement could wrongly detect a false-positive arrhythmia, or cyclic artefacts. These sequences can occur during exercise testing because when the body moves so does the heart. The quality of the electrodes can also be taken into consideration i.e. if 1 or more of the electrodes is inadequate. Filtering, filters are good because the get do away with interference however; filters can cut out the subjects signalling. A better method could be to filter the relevant electrodes by a band pass filter and the obtained results transformed to absolute values. Different heart rates in different people can be linked to fitness and whether the person is a smoker as opposed to non-smoker. Variation in heart rate is linked to breathing therefore as a person inhales the heart rate varies, this is possibly a reason as to why when subject 1 was resting within a period of about 10 minutes his heart rate was fluctuating.
Bibliography
Page 675-677 Principles of Anatomy and Physiology. Tenth Edition. Totora Grabowski.
Pages 549 – 559 Review of Medical Physiology. Twenty First Edition William F. Gangon.
References
BMJ 2002;324:1084-1087 ( 4 May )
Clinical review
ABC of clinical electrocardiography
Exercise tolerance testing
Jonathan Hill, Adam Timmis.
BMJ 2003;326:1027-1030 ( 10 May )
Clinical review
ABC of interventional cardiology
Pathophysiology and investigation of coronary artery disease
Ever D Grech.