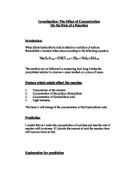
The graph shows that as the concentration of the hydrochloric acid increases, the rate of reaction also increases. The line should travel through the origin (0,0) because it is already known that when there is no hydrochloric acid in the solution, no reaction will take place between the water and the calcium carbonate chips. This would be mean that concentration of hydrochloric acid is directly proportional to the rate of reaction (concentration µ rate of reaction). Therefore, due to this direct proportion, if the concentration of hydrochloric acid is doubled, the rate of reaction should also double.
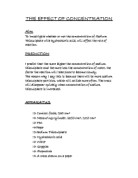
When an acid reacts with a carbonate, a salt, water and carbon dioxide are the products. This is a generalised equation for this reaction. This is what will happen in this experiment:
Hydrochloric acid + carbonate ® calcium carbonate + water + carbon dioxide
2HCl + CaCO3 ® CaCl2 + H2O + CO2
In order for a reaction to occur, two or particles must collide together with sufficient activation energy. These particles of the reactants must collide with a certain minimal energy in order for products to be made. Although the product molecules have a lower energy content than the reactant molecules, there is an energy barrier in between the reactant and product molecules. The reactant molecules must be given enough energy to surmount this barrier in order to react. Very few molecules of the reactant acquire this activation energy. The energy that the reactants must gain to overcome the energy barrier is called the activation energy. If molecules are moving fast enough part of their kinetic energy is converted into activation energy. This activation energy must be supplied in order to break the bonds in the reactants and allow new ones to be formed. As a reaction takes place the amount of each chemical reacting gets less. Therefore the amount and the concentration of the reactants fall as the amount and the concentration of the products rise. In a solid, only the particles on the surface react. As the calcium carbonate chips react with the hydrochloric acid, carbon dioxide escapes from the reaction mixture. However, the amount of carbon dioxide produced depends upon the number of effective collision. Effective collisions take place when the hydrochloric acid dissociates and the ions of this acid collide with the calcium carbonate chips and so a reaction occurs. I predict that the higher the concentration, the faster the rate of reaction and the greater the amount of carbon dioxide because there will be more hydrochloric acid molecules for the
particles on the surface of the marble chips to collide with. Therefore there will be a greater proportion of hydrochloric acid molecules with activation energy.
This reaction is exothermic because the energy of the product is lower than the energy of the reactants and so heat is taken in which results in a temperature rise.
If the solution is more concentrated, it also means that there are more collisions between the calcium carbonate chips and the hydrochloric acid particles. This is because there are more hydrochloric acid molecules in the solution for the chips to react with. Therefore the rate of reaction increases.
Factors Affecting the Rate of Reaction
1. Temperature
Increasing the temperature of the surroundings around the experiment increases the kinetic energy of the acid particles because they are the only particles they are the only particles that can move about in the solution. Therefore the collisions between the reactant substances are more frequent. More kinetic energy also means that a greater amount can be converted into activation energy. So, a greater amount of particles have this energy. Since a greater proportion of particles have more activation energy, the bonds in the reactants can be broken down more quickly and so more products can be
formed at an increased rate. Thus, increasing the temperature increases the rate of reaction and the amount of carbon dioxide gas evolved. Temperature is the only factor that increases the speed that the particles travel at.
2. The Size of Solid Particles (Surface Area)
Smaller pieces of the calcium carbonate chips increase the surface are of the solid. This increases the amount of collisions because there is more surface area of the calcium carbonate to collide with the hydrochloric acid particles and react.
3. Catalysts
A catalyst is a substance that alters the rate of reaction by lowering the activation energy. Despite speeding the reaction up, it remains unchanged and so can be used again. A catalyst works by providing the reactant particles a surface to attach to where they can collide with each other and therefore react more quickly. A catalysed reaction has a lower activation energy than an uncatalysed reaction. It is believed that a catalyst provides a different mechanism for the reaction, with lower activation energy. With a bigger surface area reaction is more likely.
4. Pressure
As the pressure increases the particles are more squashed together and so more collisions are imminent.
How to overcome these factors
1. Temperature - the experiment can be performed on the same day so that the temperature remains the same.
2. Size of Solid Particles - this can be overcome by trying to approximately pick the same sized particles.
3. Catalysts - a catalyst will not be used in this investigation.
4. Pressure- this is not involved in this particular experiment.
Experiment
Apparatus:
Conical flask Electric top pan balance
Bung with delivery tubing Water (tap and distilled)
Water Trough (tub) 2M hydrochloric acid
Three measuring cylinders Calcium carbonate chips
Diagram of Apparatus
Plan
ª The apparatus should be set up as per the diagram.
ª The room temperature should be recorded.
ª 100ml of the 2M acid should then be measured out into the conical flask using one measuring cylinder.
ª 5g of calcium carbonate chips should then be weighed using the electronic top pan balance.
ª The delivery tubing should be underneath the inverted measuring cylinder of water.
ª The chips should then be poured into the conical flask and the bung should be immediately placed into the conical flask.
ª The stopwatch should be started.
ª The inverted measuring cylinder should be held completely upright so that an accurate reading can be taken.
ª A reading should be taken off the side of the cylinder every twenty seconds.
ª This experiment should be timed for two minutes.
ª After this period, the acid and the chips should be disposed of and new chips should be used for each experiment.
ª The experiment should then be repeated, except that the concentration should be changed to 1.5M.
ª Caution must be taken to make sure that the measuring cylinder for the water and the measuring cylinder for the acid remain separate to prevent contamination.
ª The experiments should then be repeated for all the different concentrations (See below).
ª Once this has been done the repeat readings should be taken to obtain an average result and thus the results will be more accurate.
ª All results should be noted.
The Composition of the Solutions
2M - 100ml of hydrochloric acid
1.5M - 75ml of hydrochloric acid and 25ml of distilled water
1M - 50ml of hydrochloric acid and 50ml of distilled water
0.75M - 37.5ml of hydrochloric acid and 62.5ml of distilled water
0.5M - 25ml of hydrochloric acid and 75ml of distilled water
0M - 0ml of hydrochloric acid and 100ml of distilled water
Readings and Measurements
In this investigation the volume of gas evolved will be recorded every twenty seconds because this is a suitable time interval for finding a measurable change to take place. The time we will be measuring this experiment for is two minutes because this gives enough data to draw an accurate graph and we would not have to wait too long to complete one experiment. The experiment should be repeated three times an accurate average can be obtained. The readings on the cylinder will be to the nearest cm³ because this is how often the cylinder is marked so this is the most accurate it can get.
Variables
Safety Precautions
§ Care must be taken when handling the hydrochloric acid because solutions between 2M and 6.5M are irritant.
§ It can also be assumed that 1M acid solutions are also slightly irritant.
§ Goggles should be worn to protect the eyes.
Results
Conclusion
The graphs of volume against times for the 2M, 0.75M, 0.5M and 0M acid and water solutions were straight lines with positive gradients. The 1.5M and 1M solutions were positive curves. The parts where the graphs were supposed to be curving and becoming horizontal were not found. This point would have showed us when the reactants were used up and when the volume of carbon dioxide evolved remained constant. The reactant that is used up in this experiment is the hydrochloric acid because it is the only reactant out of the two that dissociates. However the results obtained gave us the initial part of the graph that was predicted. The graph for the concentration against the rate of reaction was a straight line through the origin. It was known that when the solution was all water, there would be no reaction due to the insufficient amount of activation energy. On both the graphs there was not much scatter around the lines of best fit. Nevertheless there was one anomaly in the concentration against rate of reaction graph. The graphs of time against volume of carbon dioxide evolved for each concentration showed that as the time progressed, the amount of carbon dioxide increased. Conversely, the curves for the 1.5M and the 1M solutions showed that it took a longer time for the reaction to occur at the beginning. They became steeper as the time went on, but from 20s to 40s, the lines were not straight. They only became straight at approximately 80s. The steepest graph was the 2M as was predicted. However the 0.75M and the 0.5M graphs were not very steep and this was not accounted for in the prediction. In theory, most of the prediction agreed with the results. These results were obtained because increasing the concentration increased the amount of hydrochloric acid particles in solution. The Collision Theory applies to this experiment. Although solvent molecules prevent molecules of the reactant coming together as frequently as they would in the gas phase, once they have come together, reactant molecules are less able to escape, and will collide repeatedly. These repeated collisions between molecules will lead to a reaction taking place. In a reaction between two substances A and B, a molecule of A must collide with a molecule of B. This happened between the acid and calcium carbonate particles. This reaction was exothermic because heat was taken in. This was shown by the conical flask getting warm particularly with the 2M acid. Increasing the concentration also increases the amount of activation energy that the solution has because a greater proportion of particles have this activation energy. In addition to this, the stronger the acid, the faster the dissociation of the ions and so the rate of reaction increased because more ions were able to collide with the calcium carbonate in a short time (so the volume of carbon dioxide gas evolved also increases). This concludes that as the concentration increases the rate of reaction increases due to a greater proportion of hydrochloric acid particles in solution having more activation energy.
Evaluation
This experiment is not very accurate in finding the rate of reaction because a number of things can go wrong. On the concentration against rate graph 2M point was too high. This is because the repeat readings for this particular concentration were taken on different days. On the first day the temperature was 21°C and this is why the first reading for the 2M acid was the lowest out of the three. On the second day the temperature was 22°C, which should have not made much difference, but there was a sufficient gap between the first and second results. The third day was the warmest - 27°C and this is why the third repeat reading was the highest. Increasing the temperature increases the kinetic energy of the hydrochloric acid molecules and so they travel at a faster speed, which means that there is an increased amount of collisions. Therefore the experiment reacts at a faster rate. The readings may have also been inaccurate because of particle size. The particles were always different sizes and sometimes there was even powdered calcium carbonate. The particle size affects the rate of reaction because that the smaller chips give a greater surface area for the acid to react upon. The results are not very reliable because they were not very similar. The carbon dioxide readings would not have been very accurate because some escaped through the gap in which the delivery tubing went into the measuring cylinder. Some carbon dioxide would also have been lost in the acid solution because carbon dioxide is slightly soluble in water. The range of concentrations used was sufficient, but if the experiment was to be repeated, 1.25M and 0.25M acid solutions could be used. The method was reliable but the period the experiment was timed for was too short because in the graphs of carbon dioxide evolved against time, only the initial parts of the found. A longer period of four minutes should be adequate to give the part of the graph that curves. To improve this experiment, the temperature should be kept constant for fair testing and the calcium carbonate chips should be kept the same. To keep the temperature constant, the experiment should be performed on the same day. To overcome the issue of particle size, powdered chips could be used. In the graphs of the volume of carbon dioxide evolved against the time the graphs for the 1.5M and 1M have troughs in them. This indicates that the reaction took some time to get started. This may have also been down to the fact that there were different sized calcium carbonate particles and so the results were affected in accordance to the sizes of the chips in the repeat readings. Also, to obtain better accuracy when taking the measurements on the inverted measuring cylinder, a gas syringe should be used instead. Furthermore, to measure out half a millilitre of water/acid, a more accurate method of measuring could be used, such as a measuring cylinder with a smaller scale. The range of concentrations used was adequate, but perhaps a more concentrated acid solution could be used if the experiment was to be repeated (higher than 2M). The repeat readings were not all very close to each other, which demonstrated that there were experimental errors. So as to overcome this problem, the experiment should be repeated five times so that more accurate and precise results can be obtained. Overall the experiment went well but these were some major errors that need to be addressed if the experiment was to be repeated.