From these results I can say that when the temperature is increased the rate of reaction increases. It is a very important factor in this experiment. Varying the temperature in my experiment would greatly affect the rate of reaction this is why I will keep it constant.
Concentration. Just as increasing the pressure will increase the number of particles colliding, so will the concentration. By putting more particles into the reaction, the chance of them colliding increases (because of the crowding of particles) and so the rate increases. This variable is continuous and independent. I shall test this variable. I predict that by doubling the concentration of the acid, the rate of reaction will double.
Surface area. Particles can only collide when the two sorts can meet. Therefore a reaction can only occur on the surface of the material. Therefore by increasing the area of the material, which is available to collide, the speed of the reaction will increase. I predict that doubling the surface area will double the speed of the reaction. This variable is continuous but I shall not test it because it is hard to control the exact surface area of the two reactants as they both come in an aqueous solution.
Chosen Factor
I am going to test the variable concentration. This is an independent, continuous variable. The reaction is exothermic as I found out from previous experiments (also see exothermic reaction table). Therefore even while I am testing concentration, heat will be given out by the reaction, which will give more energy to the particles and so cause them to reach their activation energy sooner. I will change the concentration of sodium thiosulphate only. The concentration of hydrochloric acid will remain constant at 2.00 mol/dm³.
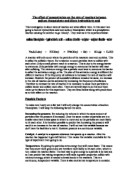
Dilute solution Concentrated solution
Less frequent collisions More frequent collisions
Fair Test
The variable I am testing is the concentration of the sodium thiosulphate, therefore the only thing that I should be changing in each experiment is the concentration of the thio and nothing else. This will make all of the tests identical (apart from the thio’s concentration), which means the experiment should be accurate and fair. Because of this any differences in the results of my experiment will enable me to see that it is due to the concentration of the thio. If I was to use two variables, and there was a difference in the results, e.g. I changed the temperature as well as the concentration and the rate of reaction sped up, I would not know which of the factors had caused this and therefore I could not reach a valid conclusion. Also to make this test fair I must keep the concentration of the hydrochloric acid constant because if it were changed it would alter the rate of reaction greatly. I will use hydrochloric acid that has a concentration of 2.00 mol/dm³ each time. Another thing that may alter the rate of the reaction is the room temperature. The greater the temperature the quicker the rate of reaction. I will monitor the room temperature on each test and if there are any anomalous results I can check to see if it has anything to do with the rate of reaction. I must also make sure that on every test I stop the stopwatch at the same degree of cloudiness to show when the reaction has finished. This is the only major unreliability in the experiment because I cannot be certain if the solution is exactly the same degree of cloudiness. I must try and be as accurate as possible.
Prediction
When sodium thiosulphate and hydrochloric are mixed, a yellow precipitate of sulphur is produced. The solution becomes increasingly cloudy and difficult to see through as more and more sulphur is formed. I predict that as I increase the concentration of sodium thiosulphate the time taken for the solution to go cloudy will decrease this is because if the concentration of a solution is increased there are more reactant particles per unit volume. This increases the probability of reactant particles colliding with each other meaning the rate of reaction will be quicker.
Plan
Apparatus
Pipette, burette, measuring cylinder, sodium thiosulphate (0.01 mol/dm³), dilute hydrochloric acid (2.00 mol/dm³), distilled water, stopwatch, conical flask, paper with cross marked on, goggles.
Method
I will measure out the required volumes of sodium thiosulphate and water (see measurement table) using a burette. I will transfer these to the flask . I will then stand the flask on a piece of paper with a cross marked on it with a pen or pencil. I will measure out the acid using a pipette, as this is highly accurate for measuring, and add it to the flask at the same time I start the stopwatch. I will then record the time for the cross to be no longer visible. I will repeat the whole procedure for more reliable and average results. If after plotting a graph I may come across some anomalous results. I will repeat the certain amounts and see what results I get the second time. If the results fit in better with the line of best fit this will tell me that a mistake was made in the first set which affected the rate of reaction.
Measurement table
Diagram
Conical flask
Thio, HCl, water solution
Cross marked on paper
Predicted graphs
Graph 1 Graph 2
time 1/t
conc. conc.
The time taken for the cross to As the concentration increases disappear decreases as the concentration time decreases increases Inverse proportionality conc = 1 time
Graph 1 – This graph shows the time taken for the cross to disappear. As we increase the concentration of thio the time taken for the cross to disappear will decrease. The graph is a curved line. It is at a slope and the gradient decreases. The graph is a curved line because the gradient which shows that the rate of reaction is changing. This graph is inverse proportionally as when the concentration is increased the time decreases.
Graph 2 – 1/t is the inverse of time and it shows the rate of the reaction. From this graph we can see that as the concentration of the thio increases the time decreases. From this graph I can predict that the concentration of thio 1/time
Preliminary results
From my preliminary results I found out that the method I used was reliable enough because looking at my preliminary graph I can see that the line of best fit is like my predicted graph. I will not alter my method in any way for my proper experiment because it will help me to get successful results such as those in the preliminary work.
Experiment Results
TEST 1
TEST 2
Exothermic Reaction Results
The results above prove that there is an exothermic reaction occurring because the temperature of the solution before the reaction is less than after the reaction by 2 degrees each time. This means that the rate of reaction will be increasing when the reaction is happening because the temperature will be increasing. However, this does not make the experiment unfair in any way because it happens for each individual test.
Conclusion
After a while I noticed the solution in the flask started to turn cloudy. This indicated that the reaction between the sodium thiosulphate and the hydrochloric acid had taken place and sulphur had been created. I realised that as I increased the concentration of the thiosulphate, the reaction was a lot faster and the solution became cloudy quicker.
I can prove this is correct by referring to my graphs which show that when the concentration of thiosulphate is increased the time for the reaction to take place is less. This is due to the particles in the solution becoming crowded together. As the concentration increases, more particles are packed into a given volume and the percentage of successful collisions increases resulting in a faster rate of reaction. I noticed that the shape of the two graphs are like those I had predicted.
I believe the results I have collected are quite reliable and seem to support my prediction. The main prediction I made was that as I increased the concentration of thiosulphate the time taken for the solution to go cloudy would decrease. I can safely say that this is true because my results and graphs confirm this theory and show the effects of increasing the concentration very clearly.
I have realised that temperature is a very important factor of this experiment and that a slight adjustment to the temperature can easily alter the rate of the reaction. Unfortunately I was not able to control the room temperature and make it the same each test due to some tests being on different days to others which possibly quickened or slowed the rate of reaction. However I monitored the temperature as well as I could and my results seemed reliable.
Evaluation
Overall I think my results have proved to be reliable and I have not encountered any major problems which might have caused the experiment to go wrong. I can confirm the reliability of the experiment by referring to the similarity of between each set of results and also the fact that the shape of the graph matches that of my predicted graph. However I did come across a couple of anomalous results. These anomalous results might have occurred because of slight mistakes in small things like timing or measuring. This shows that even minor errors can cause unreliable results. Fortunately I was able to repeat these results and they seemed to fit in better with the line of best fit.
I think my graphs have given me reliable evidence to support my predictions. I think the apparatus I used was adequate for such an experiment although there are some improvements that could be made to guarantee more accurate results. One example would be judging the cloudiness of the solution. It all depends on your eyesight whether or not you think the cross has disappeared and with different people doing the same experiment, the results are going to vary slightly depending on how good or poor your vision is.
One way of getting round this situation is to use a device which detects the cloudiness of the solution. The device can be set up as follows: firstly a beam of light is directed through the solution and on to a photocell at the other side. The photocell is linked to a voltmeter. The solution starts to get cloudy as the reaction takes place. When the solution gets so cloudy that the beam of light no longer reaches the photocell the voltmeter stops reading the voltage and a timer stops automatically. Using such a device enables you to get more accurate and fair results because the elapsed time will be recorded at the same degree of cloudiness for each test.
I think the range of results I had was satisfactory, although maybe a bigger range of measurements would make it more reliable. However I don’t think this was necessary when looking at my graph, because the range of results I obtained clearly indicates the effects of concentration on the rate of reaction.
Apart from two anomalies, which were repeated and confirmed , my experiment was generally accurate. I can confirm this is true because the line of best fit on both my graphs is similar to that on the predicted graph which demonstrates accuracy. I believe it was a fair test. I gathered enough evidence to support my prediction and therefore can say that my experiment went well.