The Effect of Enzyme and Substrate Concentrations On the Rate of a Reaction
The effect of enzyme and substrate concentrations on the rate of a reaction
Requirements:
CARE: Eye protection must be worn.
* burette (50cm )
* trough or bowl
* boiling tube with bung and delivery tube
* graduated pipette (5cm ) and safety filler
* measuring cylinder (10cm )
* hydrogen peroxide solution, 5 vol. (25cm )
* yeast suspension (20cm ), made from 2g dried yeast in 160cm water aerated for several hours
* stopwatch
Introduction:
In this experiment I will follow the progress of a catalysed reaction by measuring the volume of gas produced as the reaction proceeds. I will use the initial rates of a series of experiments to try and find the orders of reaction with respect to enzyme and substrate.
The enzyme in this reaction will be catalase, and the substrate will be hydrogen peroxide (H O ).
Catalase is an enzyme and so catalyses the decomposition of hydrogen peroxide, thus producing water and oxygen. This reaction is written as a balanced equation as follows;
2H O (aq) - 2H O(l) + O (g)
This reaction can be monitored by measuring the volume of oxygen produced as the reaction proceeds, and once all the results have been accounted for I will be able to construct a graph. The graph will show the volume of oxygen produced against time. The rate of the reaction can be found in terms of the volume of oxygen produced per second, by measuring the gradient of the curve using a tangent.
Method:
I Have chosen to work with someone else, as this will strengthen the experiment and hopefully allow me to receive better results. There are two parts to this experiment and we decided it would be best if we did part one in a lesson, and carried out part two in another lesson as there is simply not enough time to get everything done, and I did not want to rush such an important experiment. I recorded my data with the use of a spreadsheet, as this will help in constructing my graph to find the initial ...
This is a preview of the whole essay
Method:
I Have chosen to work with someone else, as this will strengthen the experiment and hopefully allow me to receive better results. There are two parts to this experiment and we decided it would be best if we did part one in a lesson, and carried out part two in another lesson as there is simply not enough time to get everything done, and I did not want to rush such an important experiment. I recorded my data with the use of a spreadsheet, as this will help in constructing my graph to find the initial rate of each reaction.
Part 1: Varying the concentration of hydrogen peroxide
1: First of all I filled the burette with water and inverted it into a trough of water, holding it in place with a clamp. Then I did a quick check to ensure that there was no apparent leakage.
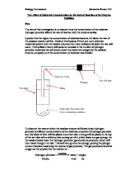
2: I then placed 2.5cm of well stirred yeast suspension in a boiling tube and set up the apparatus as shown clearly in the diagram below. I then very carefully opened the tap on the burette until the meniscus touched the 50cm mark, this being zero as the reaction is carried out upside down.
3: After ensuring that the apparatus was correctly positioned and everything was ready to go, I measured out 5cm of hydrogen peroxide in a 10cm measuring cylinder. After organising ourselves into taking turns in recording readings of volume at 10 second intervals for 4 minutes.
4: Then I added 5cm of the hydrogen peroxide to the yeast suspension and by quickly replacing the bung to the boiling tube, began the stopwatch as the first bubble reached the top of the burette. Recording the volume of gas in the burette every 10 seconds for 4 minutes was relatively straightforward.
5: After washing out the boiling tube, and refilling the burette with 50cm of water, I repeated steps 1-4 four more times using the following;
4cm H O + 1cm distilled H O
3cm H O + 2cm distilled H O
2cm H O + 3cm distilled H O
cm H O + 4cm distilled H O
in the measuring cylinder. Everything else was kept the same in each of the experiments in order to make sure that the test was a fair one.
6: Finally I plotted a graph from my results, with the volume of O given off on the vertical y axis, against time on the horizontal x axis for each experiment.
Part 2: Varying the concentration of enzyme
7: Follow the procedure in steps 1-4 in part one.
8: After washing out the boiling tube, and refilling the burette, I repeated steps 1-4 four more times, but this time using the following;
2.0cm yeast + 0.5cm distilled H O
.5cm yeast + 1.0cm distilled H O
.0cm yeast + 1.5cm distilled H O
0.5cm yeast + 2.0cm distilled H O
in the boiling tube. As before everything else should be kept at a constant, hence the temperature for example.
9: After recording the relevant results, I plotted another graph using the volume of O given off on the vertical y axis, against time on the horizontal x axis, drawing all the curves on the same axis.
Conclusion:
After completing this task, it has been interesting to see what occurs once different variables have been altered. As you can see from the spreadsheet table of results from experiment part one, when there is no distilled water present in the boiling tube the amount of O given off is fairly high compared with the other reactions containing distilled water. It is very quick and rapid at the beginning as the results show and then gradually decreases in its incline, this is apparent in all the experiments. Once distilled water has been included the amount of O given off is very low, increasingly low as the ratio of hydrogen peroxide to distilled water decreases.
There seems to be a slight hick in the results in experiment 4, this may be expected but from observing that doesn't seem to be the case. It doesn't follow the trend whereby as more distilled water is included the less O that is released, the reason being that experiment 4 seems to be lower overall in comparison to experiment 5. There only explanation that I can account for is the probability that there was some extra H O present or maybe a slight difference in the volume of enzyme. Another common problem is that the person whom is recording the data may have made a slight misjudgement.
From part two in the experiment, where the volume of yeast was altered in ratio to the distilled water, the results were much more straightforward, and fitted the expected outcome. Thus being that the less yeast added along with the more distilled water, the volume of O given off was decreasingly less. The differences amongst the separate experiments was quite large, as the amount of yeast obviously had a big impact upon the oxygen.
I have learnt from doing this experiment that you should always make sure you have the absolute correct measurements, and that the conditions are all kept at a constant to ensure a fair test, and hopefully disable any strange results. I will now construct two graphs, one for each part of the experiment. This should give a better indication of the visual effect that the variables whence changed, have an impact upon the outcome of the volume of oxygen given out.