Oxygen binds cooperatively to haemoglobin. When there is no oxygen bound to the iron (deoxy-haemoglobin) the subunits are held tightly together by salt bridges. This is the T or tense state. Once one oxygen molecule has bound to a subunit, the iron and part of the peptide chain move slightly. This loosens the structure by breaking some of the salt bridges, making it easier for further oxygen molecules to bind. The same happens when oxygen is released in tissues. The removal of one oxygen molecule makes it easier for the other oxygen molecules to be released.
In arterial blood oxygen saturation is normally 100% with venous blood being 75% saturated. When blood is 75% saturated it means that three quarters of the haemoglobin molecules are carrying 4 molecules of oxygen and one quarter of the haemoglobin molecules are carrying no oxygen.
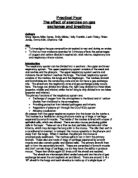
The binding of oxygen to haemoglobin can be represented by the haemoglobin dissociation curve: -
A = arterial oxygen pressure (13.3 kPa);
V = venous oxygen pressure (5.3 kPa)
Like oxygen transport, carbon dioxide transport is passive. As carbon dioxide is a waste product from cellular respiration it is found in relatively concentration in tissues. PCO2 is low in the alveoli as it is removed during expiration and as PCO2 in the atmosphere is low it is also low in arterial blood.
Carbon dioxide is transported in three ways. Carbon dioxide is more soluble than oxygen but only 7% of carbon dioxide is transported in the blood plasma as respiring cells produce far more carbon dioxide than can dissolve in plasma. Red blood cells are responsible for transporting or converting the other 93%.
Around 70% of carbon dioxide is converted into bicarbonate in the red blood cell by the reaction between carbon dioxide and water. This reaction is catalysised by carbonic anhydrase, an enzyme found in the red blood cell.
CO2 + H2O H2CO3 HCO3 + H+
The reaction is shown above. It is clear that the conversion to bicarbonate causes a major problem as hydrogen ions are produced. If too many hydrogen ions built up then a pH disturbance, or acidosis would be caused. This can depress the function of the central nervous system, leading to confusion, coma and even death. Also as the reaction is a dynamic equilibrium the products must be removed from the cytoplasm of the red blood cell to keep the reaction going.
This process occurs in two steps. Firstly the bicarbonate ions are removed on an antiport protein, with every ion of bicarbonate being exchanged for one ion of chloride. This is known as the chloride shift and the cell’s membrane potential is not affected as both ions have the same charge and so maintain electrical neutrality. Bicarbonate acts as an important extracellular buffer in the body.
The second step is to remove the hydrogen ions from the red blood cell cytoplasm. Haemoglobin acts as a buffer and binds to the hydrogen ions, removing them from the cytoplasm.
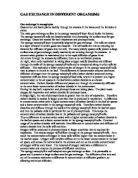
The diagram above shows how carbon dioxide from the tissue is converted to bicarbonate and hydrogen ions in the red blood cell via the carbonic anhydrase enzyme. It also shows how both hydrogen ions and bicarbonate ions are removed from the cytoplasm.
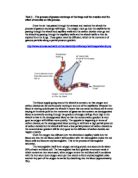
The diagram below shows how carbon dioxide is removed from the body. Carbon dioxide carried in the plasma diffuses into the alveoli via diffusion. This decrease in plasma CO2 allows CO2 to diffuse from the red blood into the plasma. As CO2 is removed hydrogen ions leave the haemoglobin molecules, this results in the chloride shift reversing, bringing bicarbonate ions back into the cytoplasm of the red blood cell. The hydrogen and bicarbonate ions then reform to carbonic acid, which then converted back to carbon dioxide. The carbon dioxide can then diffuse out into the alveoli.
The remaining 23% of the carbon dioxide in venous blood is transported by directly binding to the haemoglobin molecule. The carbon dioxide molecule binds with empty haemoglobin at exposed NH2 groups, forming carbaminohaemoglobin.
Skeletal muscles provide the force for breathing and as they have no pacemaker activity, they depend entirely on the nervous system for stimulus to contract. There are two separate neural systems that control respiration; voluntary control and automatic control. Voluntary control originates in the cerebral cortex whilst the automatic control originates in respiratory centres in the pons and medulla.
The medullary neurons generate the rhythm for involuntary breathing sending impulses to the inspiratory muscles at a rate of 12-15 times per minute. During heavy exercise neurons that send impulses to the expiratory muscles become active but under normal breathing conditions they remain quiet, as expiration is passive at rest. There are several factors, which influence the respiratory centres. If lungs become over inflated stretch receptors send impulses to the medulla to inhibit inspiration and so protecting the lungs from mechanical damage. The proprioceptors are located in the muscle, tendons and joints and are sensitive to movement, sending impulses to the respiratory centres to help to increase ventilation during exercise.
As respiration’s key roles are to provide oxygen, remove carbon dioxide and maintain body pH reflexes related to amount of these blood chemicals in the plasma are very important. PCO2 is the most important of these reflexes. When plasma PCO2 levels rises they are matched with an increase in ventilation, removing more CO2 from the blood returning levels to normal. Similarly if the levels of PCO2 in the plasma drop then ventilation slows until CO2 accumulates bringing the levels back up to normal. This reflex is very sensitive and increasing the arterial PCO2 by 1mmHg will stimulate an increase in the ventilation by about 3L per minute. The change in blood PCO2 is detected by central chemoreceptors located in the medulla. They respond to changes in PCO2 via H+ ions. CO2 diffuses easily from the blood through the blood-brain barrier into the cerebrospinal fluid. Here it is converted into HCO3- and H+ by reacting with H2O. A rise in CO2 results in a rise in H+ ion concentration. This rise in H+ ion concentration is detected on the ventral surface of the medulla leading to the stimulation of the respiratory centres and increased rate and depth of breathing.
Low PO2 and low pH levels are detected and responded to by the peripheral chemoreceptors. These receptors are found in the aortic and carotid bodies and are O2 sensitive receptors. A response is caused as K+ ion channels close in low PO2. This results in membrane depolarization leading to the opening of Ca2+ channels and initiates the secretion of dopamine. Dopamine is a neurotransmitter and stimulates the sensory nerves, increasing the frequency of impulses sent to respiratory centres and therefore increases ventilation. This reflex doesn’t appear to play a vital role in day-to-day ventilation as the arterial PO2 has to be significantly reduced. However it is important when PO2 falls below 60mmHg for example when at high altitudes or during hypoventilation.
During exercise a noticeable change in PCO2 and PO2 would be expected however this is not the case, as their levels remain nearly constant. This is due to ventilation keeping pace with metabolism and removing CO2 as fast as its produced and supplying O2 as fast as its consumed.
As stated before the respiratory system is divided in the conducting and respiratory zones. As the conducting zone does not perform gas exchange it is referred to as the anatomical dead space and has a volume of around 150ml. The volume of air, which leaves the alveoli to be exhaled, is 500ml but only 350ml reaches the atmosphere as 150ml remains in the airways or dead space. Each time air is inhaled only 350ml out of the 500ml tidal volume is fresh air, the other 150ml is stale air from the last exhalation. Alveolar ventilation is a more accurate way to look at efficiency of ventilation, as pulmonary ventilation doesn’t take into consideration the volume of the anatomical dead space.
Alveolar ventilation = (tidal volume – dead space) x breaths per min
Pulmonary ventilation or respiratory minute volume = tidal volume x breaths/min
Therefore an individual with a small tidal volume but high number of breaths per minute may have the same respiratory minute volume as an individual with a large tidal volume but lower number of breaths per minute or ventilation rate. However the individual with the small tidal volume would have much lower alveolar ventilation and would be breathing less efficiently as they use a lot of effort in moving the air back and forth in the dead space. So it is more efficient to breath more deeply than it is to increase the rate of breathing.
Methodology
Data will be collected using a Douglas bag under two conditions:
- Control (at rest whilst standing)
- During moderate exercise
The data that will be collected is breathing rate, total volume of air collected, percentage of oxygen and carbon dioxide in gas. From this the tidal volume, total volume of oxygen consumed, volume of oxygen consumed per minute, total volume of carbon dioxide produced and volume of carbon dioxide produced per minute can be calculated. This is recorded when the subject is standing and during moderate exercise. The subject will undertake 2 minutes of exercise before recordings to allow a period of equilibration. The gas will be collected using a Douglas bag and the breathing rate will be recorded using an electronic stethograph, which is recorded using Breathing rate Electronic stethograph.adicht. A nose clip is also used to prevent any air either entering or escaping through the nose, which would affect the results. The gas will be collected for 5 minutes or bag is filled. The time will be recorded so that the ventilation rate can be calculated. Once the gas is collected the valve is closed and two 50 ml syringes are taken so the gas composition can be analysed. The exercise taken by the group was stepping up and down on an aerobic step. This was done at a moderate pace. The pace of exercise was controlled using a light bulb, which flashed at regular intervals. The subjects had to step up on to the step each time the light flashed.
Results
Graph showing the average respiratory minute volume for the group under the two conditions
The graph above is the average group results for respiratory minute volume under the two conditions. The results here show a similar trend to the results for the tidal volume but the difference between the results is more marked. The standard error for is much larger for the during exercise result when compared to the control. As expected the difference between the control and during exercise median values is greater than would be expected by chance and there is a statistically significant difference as P = <0.001.
Graph showing the average respiratory rate for the group under the two conditions
The graph above is the average group results for respiratory rate. The standard error is also show. It is much smaller for the control compared to the standard error for the during exercise results. The results here show a similar trend to the results above but the difference between the control and during exercise results is smaller. The increase in breathing rate was great enough to be deemed statistically significant, as the difference in the median values between the control and during exercise is great enough to exclude the possibility that the difference is due to random sampling variability and the value of P=0.021
Graph showing average tidal volume for the group under the two conditions
The graph above is the average group results for tidal volume under the two conditions. The standard error is also show. It is relatively large for both the control and during exercise. It appears there is a marked stepped increase from the control to during exercise. I would have expected the tidal volume to have increased slightly more compared to the control. The Mann-Whitney U test was performed, comparing during exercise data to the control. It found there was no a statistically significant difference between the control and during exercise tidal volumes as P= 0.279
The graph below is the average group results for volume of oxygen expired per minute under the two conditions. The standard error is also show. It is relatively small for the control and larger for the during exercise data. This could be due to the differences between individuals becoming more apparent during exercise. There is a noticeable increase in volume expired per minute between the control and during exercise. This was unexpected. The Mann-Whitney U test was performed, comparing during exercise data to the control. It found there was a statistically significant difference between the control and during exercise tidal volumes as P= 0.005
Graph showing the average volume of oxygen in expired air for the group under the two conditions
Graph showing the average volume of carbon dioxide expired per minute under the two conditions
The graph above is the average group results for volume of carbon dioxide expired per minute under the two conditions. As before it is relatively small for the control and is larger for the during exercise data. As for the oxygen results there is a marked increase from the control to during exercise. This was expected as more respiration occurs during exercise so more carbon dioxide is produced. The Mann-Whitney U test was performed, comparing during exercise data to the control. It found there was a statistically significant difference between the control and during exercise tidal volumes as P= 0.001.
Below is the excel worksheet for the groups results.
Key
Discussion
Most of the group results fitted in with what I expected as the tidal volume increased for during exercise when compared to the control results. However the increase was not as large as would have been expected. As the respiratory system is divided in the conducting and respiratory zones with the conducting zone not performing gas exchange it is more efficient to breath more deeply than it is to increase the rate of breathing. This is due to the anatomical dead space, which has a volume of around 150ml and retains 150ml of the air exhaled from the alveoli. Therefore each time air is inhaled only 350ml out of the 500ml tidal volume is fresh air, the other 150ml is stale air from the last exhalation. The increase in volume is needed whilst exercising. It is needed as muscles are contracting more frequently and more strongly and ATP is needed in the formation of active cross-bridges between the actin and myosin fibres.
ATP is obtained via cellular respiration occurring in the cytoplasm and mitochondria of the cell. ATP is also needed for the constant anabolic synthesis processes in the body as well as for the brain and heart. Respiration requires two things; glucose and oxygen and produces water, carbon dioxide and energy.
As expected the volume of carbon dioxide expired per minute greatly increased during exercise when compared to the control. During exercise there is increased cellular respiration and so the PCO2 in the blood increases. The PCO2 levels in the blood are detected by the central chemoreceptors located in the medulla. They respond to changes in PCO2 via H+ ions. CO2 diffuses easily from the blood through the blood-brain barrier into the cerebrospinal fluid. Here it is converted into HCO3- and H+ by reacting with H2O. A rise in CO2 results in a rise in H+ ion concentration. This rise in H+ ion concentration is detected on the ventral surface of the medulla leading to the stimulation of the respiratory centres and increased rate and depth of breathing. This reflex is very sensitive and increasing the arterial PCO2 by 1mmHg will stimulate an increase in the ventilation by about 3L per minute.
The respiratory rate also increased from the control results to during exercise results. This was expected as increased ventilation is needed during exercise to provide oxygen and remove carbon dioxide. This response may have been due to reduced oxygen levels in the blood causing a reflex to stimulate increased respiratory rate. Low PO2 levels are detected and responded to by the O2 sensitive peripheral chemoreceptors found in the aortic and carotid bodies. A response is caused by the K+ ion channels closing resulting in the initiation of the secretion of dopamine. Dopamine is a neurotransmitter and stimulates the increase in the frequency of impulses sent to respiratory centres and therefore increases ventilation. This reflex doesn’t appear to play a vital role in day-to-day ventilation as the arterial PO2 has to be significantly reduced. However it is important when PO2 falls below 60mmHg for example during hypoventilation, or very intense exercise. As the exercise was only moderate this reflex would probably not a significant role.
During exercise a noticeable change in PCO2 and PO2 would be expected however this is not the case, as their levels remain nearly constant. This is due to ventilation keeping pace with metabolism and removing CO2 as fast as its produced and supplying O2 as fast as its consumed and so this indicates the both rate of breathing as well as depth of breathing are important during exercise. However the difference between the control and during exercise for the volume of oxygen and volume of carbon dioxide expired was deemed to be significant, when the Mann Whitney test was carried out on the data. It would be expected that the volume of oxygen expired per minute would decrease during exercise, however it increased a statistically significant amount but the percentage of oxygen was less in the expired air for all the individual results. This may be due to several factors. The total volume collected was larger for during exercise results and so even though the % of oxygen decreased, the volume of oxygen increased as there was a larger total volume. Therefore there would be a higher volume of oxygen expired per minute.
The proprioceptors are located in the muscle, tendons and joints and are sensitive to movement, sending impulses to the respiratory centres to help to increase ventilation during exercise. So when exercise was under taken the proprioceptors may have been partly responsible for the increase in respiratory rate during exercise.
There were variations in the results for the group; this could be due to a numbers of factors. These factors are:
- Age
- Fitness
- Whether the individual was a smoker or former smoker
- Whether the individual had a cold or other illness which may reduce their ability to breath normally
- Height or size
- Gender
The during exercise respiratory rate had the most variation and the factors above would tend to affect this, as taller people tend to have a larger tidal volume compared to shorter people and so breath more deeply rather than more quickly. The same is true for fitness as the fitter people tend to have a larger tidal volume compared to less fit people. The pace or intensity at which exercise was taken would have had an effect on the during exercise results. Not all the may have been group following the same pace of exercise, to improve this I would use a treadmill as a form of exercise as the pace can be determined and the group must stick to the pace to avoid falling over.
Another problem is that breathing is controlled by automatic and voluntary systems. Therefore an individual could in theory slow or quicken their breathing voluntarily by looking at the screen. To prevent this the individuals would either face the opposite direction or wear a blindfold.
A problem found with the stepping exercise was that the breathing pattern during exercise had a stepping rhythm as shown in the trace below. This meant it was difficult to calculate the number of breaths and also the person may have expired more than they inspired, which could be a reason why the volume of oxygen expired per minute increased during exercise.
Control During exercise
The during exercise trace doesn’t have peak as the results go out of range as the equipment needs to be adjusted.