The Effect of Glucose Concentration on the Rate of Osmosis
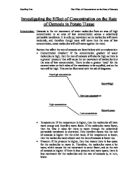
The Effect of Glucose Concentration on the Rate of OsmosisAims In this investigation I’ll be working to know:• How does the concentration of glucose solution affect the rate of osmosis in potato chips? • Why does the concentration of glucose solution affect the rate of osmosis in potato chips? • How does the mass of potato chips changes in different concentration glucose solutions?IntroductionThe purpose of this investigation is to observe the factors that affect the rate of osmosis in potato chips and investigate the movement of osmosis through the cells of potato. Background information Diffusion is the net movement of particles from a region of high concentration to a region of low concentration until the concentrations are equal. The speed of diffusion depends n the differences between the concentrations to begin with.Osmosis is a special type of diffusion, it occurs across a permeable membrane which allows some particles to diffuse through it and prevent others. Therefore osmosis is the passage of water from a region of high concentration to a region of low concentration through a semi-permeable membrane.The direction and the rate of osmosis depend on the difference in water concentration between the two sides of the membrane and this movement will continue until equilibrium is reached.Cell membranes will allow small molecules like oxygen or water or carbon dioxide or glucose to pass through but they will prevent larger molecules like sucrose or starch or protein to pass through.The tendency of water to move through a partially permeable membrane is described as its water potential and is at a maximum in pure water. As solutes are added the water potential lowers and this means that more concentrated solutions have lower water potentials than more dilute solutions and so the water will have a greater tendency to move from pure water to any aqueous solution and from a more dilute solution to a more concentrated solution. The cytoplasm of a plant cell and the cell sap in the vacuole contain salts, sugars and proteins which effectively reduce the concentration of free water molecules inside the cell. The cell wall of a plant cell is freely permeable to water and dissolved substances but the cell membrane of the cytoplasm is partially permeable. If plant is surrounded by water or a solution more dilute than its contents water will pass into the vacuole by osmosis and the vacuole will expand and press outwards on the cytoplasm and cell wall, so there comes a time when the inflow of water is resisted by the un-stretchable cell wall. A plant cell with the vacuole pushing out on the cell wall is said to be turgid and the vacuole is exerting turgor pressure on the cell wall. If all the cells in a leaf and stem are turgid the stem will be firm and upright and the leaves held out straight, if the vacuoles lose water for any reason then the cells will lose their turgor and become flaccid.As we know the rate of reaction can be changed by:• Changing the surface area of any solids involved• Changing the concentration of any solutions involved • Changing the pressure if gases are involved• Changing the temperature at which it is carried out • The use of catalystChanging the surface area can only affect reactions where solids are involved. By increasing the surface area the particles will have more surface area to work on, so the rate of the reaction will be faster as there is going to be more frequent collisions per second.Changing the concentration in liquids (changing pressure in gases) can also affect the rate of reaction. Concentration means that there are more particles of reactants knocking about between the water molecules and pressure also means that there are more reactant particles moving in the air, and having more reactant particles make them more likely to collide so more collisions will happen per second.Catalyst is a substance that is used in a chemical reaction to speed it up with out being used or changed. It acts like a surface which sticks particles on it and force them to collide.When the reaction mixture is heated the particles acquire more energy and start moving around faster which will allow more collisions per second, as the particles will be more likely to collide with each other successfully with high energy.In my investigation I am going to concentrate on the affect of concentration on the rate of osmosis between a glucose solution and potatoes chips.PlanI am going to monitor how the concentration of glucose solution affects the rate of osmosis in potato chips. Briefly I am going to cut 10 potatoes cylinders (with 50mm length and 5mm width each) and weight each one before I place each one in a test tube filled of 10ml of glucose solution where each tube will have a different concentration level of glucose solution. After 24 minutes I will take all the potato chips out off the test tubes and record their weight and length. Then I will work out the average difference between the weight and length of each potato chip before being put in the glucose solution and after being taken out. I will experiment the
affect of glucose solution on the potato chips using variety of concentrations, 0M, 0.10M, 0.20M, 0.30M, 0.40M, 0.50M, 0.60M, 0.70M, 0.80M, 0.90M and 1.00M. Then I will repeat the whole experiment exactly the same for another 2 times to get more precise and reliable results, also if any result does not fit in the pattern I will repeat in order to get as low anomalies as possible.Then I will plot the results in a table and draw two graphs, one for concentration against mass and one for concentration against length. Then I will analyze my evidences, draw a conclusion and ...
This is a preview of the whole essay
affect of glucose solution on the potato chips using variety of concentrations, 0M, 0.10M, 0.20M, 0.30M, 0.40M, 0.50M, 0.60M, 0.70M, 0.80M, 0.90M and 1.00M. Then I will repeat the whole experiment exactly the same for another 2 times to get more precise and reliable results, also if any result does not fit in the pattern I will repeat in order to get as low anomalies as possible.Then I will plot the results in a table and draw two graphs, one for concentration against mass and one for concentration against length. Then I will analyze my evidences, draw a conclusion and evaluate my experiment.Variables that could be tested • The rate of osmosis.• The affect of glucose on the vacuole.• The affect of concentration on the rate of osmosis.• The mass of potato chips.• The time taken for the potato chips mass to increase by 5g. • The length of the potato chips.• The width of potato chips.I will be testing the rate of osmosis using different concentrations, by taking the difference of mass and length of the potato chips before being put in the glucose solution and after being taken out. Therefore the concentration is the only variable that is going to be changed.What will I measure? I will measure the average difference of mass and length between before being put in the glucose solution and after being taken out. How to make it fair testThere are a lot of factors that should be kept the same during the experiment• The same amount of glucose solution must be added to the test tubes.• The potato chips must have the same length.• Put the potato chips in the test tubes at the same time.• Leave the potato chips for the same amount of time or otherwise more molecules could be absorbed by the cell or left from the cell.• Put the potato chips for the same amount of time in the same conditions because the results may be different if the test tubes are kept in the light than being kept in the dark.• Use the same measurements scales every time to reduce the inaccuracy level.• Put all the test tubes in the same place to prevent any change in the temperature so rate of water absorption will not be affected.Measurements in each experiment• Potato chips with 50mm length and 5mm • 10ml of glucose solution in each test tubeI have decided (by using my preliminary work on page5) to use these measurements because I think that they will give me reasonable results and provide me with better graphs.Health and safety procedures • Be careful with the scalpel and the cork borer.• Do not hold the potato in your hand while using the cork borer to cut off the potato cylinders but use the mat.• Stand up while doing the experiment and put the stools under the benches.• No eating or drinking while experimenting.• If in doubt about anything ask the teacher.• Do not run in the lab.• Do not place the test tubes or any tool on the edge of the bench.Apparatus• Ten 15ml test tubes to put glucose and potato chips in.• Test tube rack to hold the ten 15ml tubes.• 1M glucose solution with different concentration to place the potato chips in them.• Water to dilute sugar solution.• Measuring cylinders to measure the glucose solution that is put in the test tubes.• Potato to get chips of it.• Cork borer to get the potato cylinders.• Ruler to measure the length of the potato chips.• Scalpel to cut the potato cylinder.• Mat to cut the potatoes on it.• Stop watch to measure the 24 minutes.• Set of scales (accurate to 1/100 of a gram) to measure the potato chips mass.• Filter to dab the potato chips.• Thermometer to check the room temperature.• Labels to stick on the test tubes.Preliminary work Before I set up my method I have used the computer software “Focus Educational Software – Science Investigations 2” as a part of my preliminary work. The data in the table below were taken by the “Science Investigations 2” and they represent the change in mass in the potato chips due to osmosis. As you can notice I the starting mass for the potato chips was different each time which make it harder to spot the anomalies.I wanted in my plan to investigate how osmosis affects the length of the potato chips but I could not do it using the computer stimulations.MassConcentration (M) Before (g) After (g) Average change (g)Exp.1 Exp.2 Exp.3 Exp.1 Exp.2 Exp.3 0 7.33 7.94 8.203 9.505 9.444 10.378 4.4040.10 8.06 7.691 8.933 8.82 8.569 9.693 1.8910.20 7.937 7.897 8.81 8.341 8.163 9.214 0.8040.30 7.944 7.951 8.817 7.711 7.555 8.584 -0.7070.40 7.935 7.803 8.808 7.505 7.356 8.378 -1.020.50 7.954 7.924 8.827 7.261 7.124 8.134 -1.7240.60 8.034 8.767 8.907 7.009 7.706 7.882 -2.4280.70 8.5 7.845 8.875 7.235 6.697 7.727 -2.7960.80 8.074 7.978 8.947 6.798 6.827 7.671 -2.8520.90 8.002 7.987 9.373 6.654 6.4 7.692 -3.4951.00 7.923 7.767 9.073 6.518 6.604 7.391 -3.129*Average change: The different between the mass before and after being put in the glucose.To calculate the average change I have added the averages (different between the “after mass” and the “before mass”) of the three experiments and divided them by 3. By doing my preliminary work I have achieved many aims, and one of these aims was to test and check the accuracy and correctness in choosing 5cm potato chips; and what I have found is that this measurement is reasonable because the average change in mass is going to be reasonable and provide me with good graphs.The preliminary work was useful for me as I have became familiar with what I am going to do in the experiment beside giving me a clear idea about what I can include in my method. Also it helped me in checking my plan, which I think is correct. So I will leave the plan as it is now.MethodAfter doing my preliminary work I know exactly which measurements I am going to use to obtain the reliable and correct results.After setting my equipment up as shown in the diagram below, I will set up ten 15ml test tubes and place them in the test tubes rack to save time. Then using the scalpel, ruler and the cork borer I am going to cut 10 potatoes cylinders, length and 5mm width each. Then I use the measuring cylinders to help me in pouring 15ml of glucose solution, with different concentrations (0M, 0.10M, 0.20M, 0.30M, 0.40M, 0.50M, 0.60M, 0.70M, 0.80M, 0.90M and 1.00M), in the test tubes and label them individually to avoid confusion later on. After that I will measure the temperature of the room. Then I will measure the mass (g) of each potato chip to 3 decimal places, in order to get accurate results, and put each potato chip in front of a test tube (not inside it) and record the mass in my results table. Then I will quickly put the potato chips in the test tubes and start timing.After 24 minutes I will empty all the test tubes leaving the potato chips alone inside them. After that I will take the potato chips off the test tubes one by one and dab it using the filter, to get rid of the excess water that can provide me with inaccurate weights, before recording their new weights and lengths. Then I will work out the average difference in mass and length of each potato chip between before being put in the glucose solution and after being taken out.Then I will repeat the whole experiment exactly the same for another two times to get more precise and reliable results, also if any result does not fit in the pattern I will repeat in order to get as low anomalies as possible.Then I will plot the results in a table and draw two graphs, one for concentration against mass and the other one for concentration against length, before analyzing my results and graphs.PredictionI predict that as the concentration increase the rate of osmosis will increase, and that is because water molecules move from the weaker solution (high concentration) into the stronger solution (lower concentration) until equilibrium is reached. So when the glucose solution is stronger than the cell sap of the potato cells water molecules will move from the potato cells into the glucose solution decreasing the chip’s mass, while when the glucose solution is weaker than the cell sap of the potato cells water molecules will move into the potato chip’s cells increasing its mass. If potato chip is surrounded by water or a solution more dilute than its contents water will pass into the vacuole by osmosis and the vacuole will expand and press outwards on the cytoplasm and cell wall, so there comes a time when the inflow of water is resisted by the un-stretchable cell wall. If the potato chip’s cell vacuole is pushing out on the cell wall it is said to be turgid and the vacuole is exerting turgor pressure on the cell wall. If all the cells in the chip are turgid it will be firm and longer and if the vacuoles lose water the cells will lose their turgor and become flaccid and shorter. So when the potato cells gain water molecules they will lose turgor and the potato chip will become flabby and shorter, while when the potato cells lose water molecules their cell wall will become turgor and the potato chip will become firm and longer.So I predict that there will be loss and gain in the masses and lengths, also I predict that as the concentration increases the average change in mass and the length will decrease. I predict that the average change in mass and length will be indirectly proportional, and they will lead to negative correlation graphs.This graph shows negative correlation This graph shows negative correlation I also predict that the graphs may be curved as the decreasing is not happening in the same ratio.Results Tables* Room temperature = 28°CMasses Table(Table 1)Concentration (M) Before (g) After (g) Difference (g) Average Difference (g)Exp.1 Exp.2 Exp.3 Exp.1 Exp.2 Exp.3 Exp.1 Exp.2 Exp.3 0 8.055 7.945 7.784 9.466 9.441 9.321 1.411 1.496 1.537 1.4810.1 7.836 7.929 7.915 8.778 8.728 8.619 0.942 0.799 0.704 0.8150.2 7.845 7.851 7.739 8.022 8.074 8.219 0.177 0.223 0.48 0.2930.3 7.865 7.933 7.916 7.597 7.736 7.664 -0.268 -0.197 -0.252 -0.2390.4 7.882 7.848 7.938 7.451 7.335 7.301 -0.431 -0.513 -0.637 -0.5270.5 7.921 7.847 7.829 7.092 7.137 7.045 -0.829 -0.71 -0.784 -0.7740.6 7.751 7.892 7.787 6.989 6.996 6.774 -0.762 -0.896 -1.013 -0.890.7 7.725 7.966 7.874 6.808 6.881 6.689 -0.917 -1.085 -1.185 -1.0620.8 7.879 7.836 7.808 6.613 6.641 6.664 -1.266 -1.195 -1.144 -1.2020.9 7.874 7.845 7.864 6.549 6.601 6.562 -1.325 -1.244 -1.302 -1.291 7.852 7.892 7.892 6.445 6.566 6.491 -1.407 -1.326 -1.401 -1.378* The yellow shaded cells are the anomalies results. * I have repeated the experiment for the anomalies results, and the new results are on (Table 3) on page 9.Lengths Table(Table 2)Concentration (M) Before (mm) After (mm) Difference (mm) Average Difference (mm)Exp.1 Exp.2 Exp.3 Exp.1 Exp.2 Exp.3 Exp.1 Exp.2 Exp.3 0 50 50 50 55 54 52 5 4 2 3.6670.1 50 50 50 54 52 53 4 2 3 30.2 50 50 50 51 51 55 1 1 5 2.3330.3 50 50 50 51 53 50 1 3 0 1.3330.4 50 50 50 50 49 52 0 -1 2 0.3330.5 50 50 50 51 48 49 1 -2 -1 -0.6670.6 50 50 50 46 45 44 -4 -5 -6 -50.7 50 50 50 45 45 47 -5 -5 -3 -4.3330.8 50 50 50 47 45 45 -3 -5 -5 -4.3330.9 50 50 50 44 42 45 -6 -8 -5 -6.3331 50 50 50 42 41 44 -8 -9 -6 -7.667* The yellow shaded cells are the anomalies results. * I have repeated the experiment for the anomalies results, and the new results are on (Table 4) on page 9.Masses Table(Table 3)Concentration (M) Before (g) After (g) Difference (g) Average Difference (g)Exp.1 Exp.2 Exp.3 Exp.1 Exp.2 Exp.3 Exp.1 Exp.2 Exp.3 0 8.055 7.945 7.902 9.466 9.441 9.543 1.411 1.496 1.641 1.5160.1 7.919 7.929 7.915 8.807 8.728 8.619 0.888 0.799 0.704 0.7970.2 7.845 7.851 8.075 8.022 8.074 8.317 0.177 0.223 0.242 0.2140.3 7.865 7.993 7.916 7.597 7.926 7.664 -0.268 -0.067 -0.252 -0.1960.4 7.882 7.848 7.935 7.451 7.335 7.438 -0.431 -0.513 -0.497 -0.480.5 7.985 7.847 7.829 7.24 7.137 7.045 -0.745 -0.71 -0.784 -0.7460.6 8.071 8.019 8.113 7.143 7.014 7.053 -0.928 -1.005 -1.06 -0.9980.7 7.913 7.966 7.874 6.902 6.881 6.689 -1.011 -1.085 -1.185 -1.0940.8 7.955 7.836 7.808 6.768 6.641 6.664 -1.187 -1.195 -1.144 -1.1750.9 7.874 8.031 7.864 6.549 6.725 6.562 -1.325 -1.306 -1.302 -1.3111 7.852 8.061 7.892 6.445 6.633 6.491 -1.407 -1.428 -1.401 -1.412* The yellow shaded cells are the repeated experiments due to the anomalies results found on (Table1) on page 8.Lengths Table(Table 4)Concentration (M) Before (mm) After (mm) Difference (mm) Average Difference (mm)Exp.1 Exp.2 Exp.3 Exp.1 Exp.2 Exp.3 Exp.1 Exp.2 Exp.3 0 50 50 50 55 54 54 5 4 4 4.3330.1 50 50 50 53 52 53 3 2 3 2.6670.2 50 50 50 51 51 52 1 1 2 1.3330.3 50 50 50 51 50 50 1 0 0 0.3330.4 50 50 50 50 49 49 0 -1 -1 -0.6670.5 50 50 50 48 48 49 -2 -2 -1 -1.6670.6 50 50 50 47 47 47 -3 -3 -3 -30.7 50 50 50 46 45 47 -4 -5 -3 -40.8 50 50 50 45 45 45 -5 -5 -5 -50.9 50 50 50 44 43 45 -6 -7 -5 -61 50 50 50 42 43 44 -8 -7 -6 -7* The yellow shaded cells are the repeated experiments due to the anomalies results found on (Table2) on page 8.Graphs AnalysisGraph 1 shows the average change in mass. It shows an inversely proportional curve line which is forming a negative correlation, which means that as the concentration increase the mass decrease, exactly as I have predicted. I can notice that some of the results do not fit with the curve line, for example at 0.7M and 0.8M the points were a few grams upper the trend line and I think this is due to the excess water that might be left on the potato chip itself or between its cells which in turn increase the mass, also misreading the scale might be the cause. From my first graph I estimate that the concentration of the cell sap inside the potato chips is 0.25M.Graph 2 shows the average change in length. It shows an inversely proportional straight line forming a negative correlation, which means that as the concentration increase the length decrease, as I have predicted. First of all I have noticed that the results forms nearly a straight line but with exception of the 0M (pure water), may be because that solution was pure water and did not contain any glucose. Using the second graph, I estimate that the concentration of the cell sap inside the potato chips is 0.36M. Graph 2 is more precise and accurate than graph one, as graph 2 have nearly a straight line and I think this is because in the first method (mass) it was very hard to maintain accuracy due to excess water on the potato chip and between its cells, while in the second method (length) it was easier to obtain more precise and accurate results because the change was obvious and can be measured easily by ruler.ConclusionI have concluded that the concentration can affect the movement of water through the permeable membrane in other word I have concluded that as the concentration increases the rate of osmosis increase so as the concentration gets higher the potato chips will lose more mass and length. And the results obtained in my experiment supports my conclusion, because they showed me a decrease in mass and length as the concentration increased.And this is because when a substance such as sugar dissolves in water, the sugar molecules attract some of the water molecules and stop them moving freely, and this reduces the concentration of free water molecules, so the free water molecules inside the potato’s cell sap will be more than those in the solution, which means that the water molecules will move from the region with more free water molecules (potato chips) to the region of less free water molecules until equilibrium is reached, also the free water molecules move around randomly and the greater the concentration of free water molecules, the higher the water potential is and more dilute the solution is and as the concentration of glucose increases the water molecules are less able to move to the potato causing water from potato to move to the solution reducing the length and the mass. But even though the sugar molecules can diffuse into the potato’s cell sap but it is slower than the free water molecules because of its big molecules. Also if potato chip is surrounded by water or a solution more dilute than its contents water will pass into the vacuole by osmosis and the vacuole will expand and press outwards on the cytoplasm and cell wall, so there comes a time when the inflow of water is resisted by the un-stretchable cell wall. If the potato chip’s cell vacuole is pushing out on the cell wall it is said to be turgid and the vacuole is exerting turgor pressure on the cell wall. If all the cells in the chip are turgid it will be firm and longer and if the vacuoles lose water the cells will lose their turgor and become flaccid and shorter. So when the potato cells gain water molecules they will lose turgor and the potato chip will become flabby and shorter, while when the potato cells lose water molecules their cell wall will become turgor and the potato chip will become firm and longer, and when I said that there will be loss and gain in the masses I was right. So every thing I have predicted is right and correct.As the cell loses water, the volume of the cell decreases and eventually the cell surface (plasma) membrane may lose contact with the cellulose cell wall. In this condition, the cell is said to be plasmolysed and in my results table, above 0.3M is plasmolysed.Evaluation The experiment process went well and there were no problems during it at all. The method covered all the needs, as well as being a fair test. The results obtained were as precise and reliable as possible, considering that it was very difficult to maintain precise and accurate results, for example it was extremely difficult to keep all the potato chips weight the same and have the same surface area, as human error is likely to happen and to avoid this inaccuracy in future I will use a cutter that cuts all the chips same. Also when weighting them after being put in the glucose solution was not that accurate because of the excess water, even though I have dabbed them but this might also dab the not excess water. Also it was impossible to put all of the chips in the test tubes at the same time as well as taking them off the tubes. I have tried my best to repeat it three times using a fair test method, but even though there were some anomalies, which I have repeated again, and they are shaded in yellow in the tables of results. A good point to mention here is that when I have repeated the experiment I have changed the mass and the length results because if the mass result was wrong the length result would be wrong. Also repeated I have tried to investigate the reason behind getting them out of the pattern and I think that this might be done by the excess water on the potato chips or between the cells in the potato chips, also the reason might be a misreading of scale or a mistake by taking the measurements of the glucose solution and the diluting water. Another possible reason could be the affect of temperature on the rate of osmosis, because as we know temperature affects the rate of osmosis by speeding up the molecules which will decrease the time needed for a certain length or mass to be reached. However there are still some experimental errors which can be identified by looking on the graphs. Graph 2 is more precise and accurate than graph one, as graph 2 have nearly a straight line and I think this is because in the first method (mass) it was very hard to maintain accuracy due to excess water on the potato chip and between its cells, while in the second method (length) it was easier to obtain more precise and accurate results because the change was obvious and can be measured easily by ruler. According to my evidences my conclusion, which is that as the concentration increases the rate of osmosis increase and as the concentration gets higher the potato chips will lose more mass and length, is right and a good prove is that I have repeated the experiment three times; also I have repeated the anomalies which did not fit in pattern with the rest of results in order to get the reliable and precise results. And by repeating the anomalies I have got a very precise and accurate mean that helped me to plot precise points in my graphs.Also I wished to extend it more and to see how changing other factors such as the temperature and surface area can change the rate of osmosis, also I wanted to experiment how concentration can affect the rate of osmosis of apple and then compare the thickness of the potato’s cell wall and the apple’s cell wall. But unfortunately I did not have enough time.Done By AbdulBibliography• GCSE Science Class Book – By David Baylis, Graham Booth and Bob McDuell.• GCSE Biology third edition – By D. G. Mackean.• Exchange and Transport, Energy and Ecosystems – Nelson Advanced Science (NAS) – Revised Edition – By John Adds, Erica Larkcom and Ruth Miller.• Focus Educational Software, Science investigations2.