Catalase is an enzyme found in almost all living tissue, because it catalyses a added product of aerobic respiration, hydrogen peroxide to produce water and oxygen. Hydrogen peroxide is a toxic substance and catalase removes this product by catalysing it. I predict that as the pH increases so will the activity of the enzyme increase until it reaches its optimum pH, after this it will decrease. The graph will have a bell jar shape to it, as enzymes pH ranges vary and some may have very wide range of pH preferences. This is because the pH ionises some of the amino acids in the side chains of the protein globular shape. As the pH changes the ionisation of its constituents amino acids changes and the ionic bonds, which help to stabilise, are broken. As a result, the protein changes shape and therefore the active site will also have changed shape and is denatured.
The activity of this catalase can be measured by the rate of oxygen bubbles released from the reaction. We all decided to use minced potato as a source of catalase however; you could find catalase almost anywhere. To vary the pH we used a buffer solution using, citric acid and sodium phosphate. We decided to use pH values of 4.4, 5.2, 6.5 and 7.5 because they show a variety of pH’s and so we could get a range of results.
Apparatus:
-
Citric acid-sodium phosphate buffer solutions. Theses were made up by as the following. 21g citric acid H2O dm-3 and 28.4g anhydrous disodium phosphate Na2HPO4 dm-3. The table below it shows the composition of citric acid-sodium phosphate buffer solution at various pHs.
-
Hydrogen peroxide solution, 20cm3
-
Minced potato, 3cm3
-
5cm3 plastic syringe with end cut off to measure minced potato
- graduated pipette or syringe to measure buffer solutions
- conical flask, where reaction occurs
- bung, to seal reaction from escaping oxygen
- measuring cylinder to measure volume of oxygen bubbles released
- stop watch
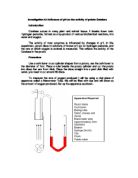
Method:
The pH I was assigned to was 6.5. Firstly I made the buffer solution which I measured out 14.5/cm3 of citric acid and 35.5/cm3 of sodium phosphate using a measuring cylinder, which I then put into the conical flask. I added the 3cm3 minced potato into the flask with the already made buffer solution. I then swirled the solution gently to ensure that they mixed. Then I set up my apparatus and filled the measuring cylinder and beaker with water, I also ensured that tube from my solution to the measuring cylinder was air tight. When everything was ready and fully set up I measured out 5cm3 of hydrogen peroxide into a syringe and injected it into the conical flask containing the potato and buffer solution. I then immediately replaced the bung to prevent as little as possible oxygen escaping, I recorded the volume of oxygen bubbles every 30seconds for 5minutes in a results table.
To ensure fair testing and no cross contamination I washed all my apparatus first with distilled water and then the solution that was going to be used in it.
Risk assessment:
The risks involved in this experiment were citric acid which is an irritant as it causes irritation to your skin, and could damage your eyes if it came into contact. Hydrogen peroxide is a corrosive solution and very oxidising so therefore great care needs to be taken when using these solutions. To prevent damage to skin or eyes wear goggles and a lab coat, and washing hands afterwards.
Observation:
Average Results:
I decided to plot rate / min because then I get the rate of reaction per minute. However in this experiment plotting the oxygen evolved will be similar in shape of graph, so therefore I will plot both these lines on one graph which enables me to compare the two.
Analysis:
As the pH increases so does the rate of reaction, this is because as the concentration of hydrogen ions increase the amount of amino acids side chains which are ionised which also increase, therefore more enzymes will be at their optimum pH and have their active site specific for the substrate. As the hydrogen ions form hydrogen bonds with the amino acids it changes the shape of the globular protein because it causes the ionic bonds which hold the structure together to break. This ensures that each enzyme has its own optimum pH because each enzyme will “look” differently in different pH’s. At the pH of 7.5 the rate of reaction was at the highest, which suggests that catalase prefers a higher pH. If we had continued we might have seen a decrease in the rate of reaction of we could have found out if 7.5 was the actual optimum pH, therefore this shows that because we only have 4 points on our graph that it is not very accurate and because we only have one decimal place it is not very precise.
Evaluation:
Our collective results are somewhat accurate but not as accurate as it could possibly be because of several limitations either by the method used or because of human fault. Other problems might have been caused by
- Cross contamination could occur very easily as we used equipment which has been used for many different experiments and solutions this could have contaminated our solutions.
- The reading taken every 30 seconds. It is very challenging to take a reading at the 30 second especially if the rate of reactions was constant.
-
Measurements where hard to accurately measure, for example accurately measuring 3cm3 minced potato, and also everyone was using a different size surface area for the potato.
- It was a quantitative experiment which meant it was more accurate than a qualitative experiment but was still left for human judgement.
From the above you can see that our results were of a tentative nature because even though we tried to be as accurate as possible by controlling all the other variables, the things listed above still made our experiment very inaccurate.
If I was to do the experiment again I would controlling or overcoming more of the problems listed above, like used a more accurate means of measuring the volume of oxygen evolved, I could use an airtight glass syringe the oxygen would then move the syringe as more was produced. I would also like to have a more varied range of pH’s especially where the rate of reaction increases dramatically towards the optimum temperature.