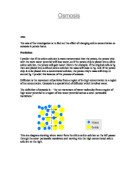
In distilled water, the potato will gain mass, because there is a higher concentration of water outside the potato than inside it, therefore water will move from outside to inside the potato’s cells.
Below (fig.2) I have made a graph of the mass change that is expected to happen for the potatoes in the different sucrose solutions.
Apparatus
The apparatus needed for my experiment area:
-5 Beakers
-4 different sucrose solutions (0.2M, 0.4M, 0.6M and 1.0M)
-Distilled water
-A tile
-Tissue paper
-A stopwatch
-A ruler
-A weighing scale
-A large potato
-A knife
-A cork borer
-A measuring cyclinder
-3 blue pins, 3 white pins and 3 purple pins
-Tweezers
Method and Data Collection
First of all, I prepared a range of sucrose sugar solutions at the molarity of 0.0M, 0.2M, 0.4M, 0.6M and 1.0M. I have chosen these values because I have found out that the molarity of a potato is 0.27M, therefore I will need sucrose solutions with similar molarities to this, so 0.2M and 0.4M are ideal because they are between this value, so we will be able to see the mass change from mass increase to mass decrease well. This is done by putting the correct amounts of distilled water with sucrose solution.
Using the cork borer, I will press it into the potato to get a long piece of potato. I will use a ruler to measure the pieces of potato to the same length, and cut them into pieces of all the same size, so that I maintain the surface area of the potatoes constant. Using this process, I will cut out 12 potato cubes, all of which will be the same size. Each of these potatoes is then weighed using a scale, and the weights will be notated. The potatoes will be split up into groups of 3, so there will be 4 groups of 3. Each of the 3 potatoes in the group will have a different coloured pin put into in (weighing 0.1g) so that we can identify which potato is which from the group. The first potato in the group will have a blue pin in it, the second will have a white pin in it and the third potato will have a purple pin in it.
We then put the first bunch of potatoes in the distilled water (0.0M). Following this, we put the second bunch of potatoes in the 0.2M sucrose solution, and a few minutes after this, we put in the third bunch of potatoes in the 0.4 sucrose solution. The time for when each of the bunches of potatoes were put in the solutions were noted. After 10 minutes of putting the first bunch of potatoes in the distilled water solution, they were taken out of their beakers with tweezers, and placed onto tissue paper to dry off the excess solution on them, so that water that was not inside the potato due to osmosis was taken off. The potatoes were then weighed after being dried, and placed back into their solution. The masses of the potatoes were noted.
After 10 minutes of the second bunch of potatoes being in their solution (0.2M), they were dried and weighed the same as the potatoes in the 0.0M solution. The same process will occur for the potato cubes in the 0.4M solution. After it has been in its solution 10 minutes they are weighed and dried. After another 10 minutes of the potato cubes being in their solutions, they are dried and re-weighed as before. This same process will occur after another 10 minutes in their solution, and again after 10 more minutes. After this has been done, I will have a full set of collected results for the potato cubes in the 0.0M, 0.2M and the 0.4M solutions.
Following this, the same will be done the 0.6M and 1.0M solutions. I will do the 0.6M and 1.0M separately because then I can weigh the potato cubes in the 0.0M, 0.2M and 0.4M in the right time. If I did do these all at the same time, I will probably not be able to weigh them at the right time, because as I am weighing one group of the potatoes, it would time to weigh another, and the experiment would go wrong.
Results
Using the results collected, I will average out the masses of the 3 potatoes. This is done so that I can minimise the impact of anomalous results from individual potatoes.
With this, I can now calculate the average % mass change.
Analysis
Now that these tables have been made, I will make scatter graphs for each of the groups of potatoes in each sucrose solution, so I can find the rate of osmosis in each of the sucrose solutions.
Now that I have made graphs of the percentage mass change in each of the sucrose solutions, I will analyse my graphs.
In the 0.0M solution (fig.3), the mass rises, then falls then rises again, which is not what I expected. I expected the mass to steadily rise as time went by. This is probably because the sizes of the potatoes were different and also when drying the water off the potato, the tissue may have absorbed water from the potato internally.
For Fig.4, contrary to what I expected, the trend line is almost completely straight, which tells me the amount of water in a potato is 0.2M instead of 0.27M. When looking at the points plotted, I can see that the mass of the potato increase, then drops, then stays the same then increases, again probably due to mistakes in the experiment, but giving me a good general trend in the results.
For Fig.5, the general trend of the graph is what I expected, in that the mass of the potato decreases because the concentration of water inside the potato is more than the concentration of water in the sucrose solution. Looking at the points, the weights of the potato after 10 and 20 minutes are anomalous results, because they rise in mass rather than lose mass. This again is probably due to the tissue absorbing too much water.
The trend line of figure 6 is of a lower gradient than the gradient of figure 5 line. This is what I expected, because in figure 6 the molarity of the solution is 0.6M, and in figure 5, the molarity of the solution is 0.4M, so the rate of osmosis will be faster in figure 6 because the concentration gradients are larger. There are no very anomalous points in this graph, because the mass decreases with time as I expected.
For figure 7, the gradient of the line is even lower than that of the line in figure 5 and 6, which tells me that this line depicts the pattern I expected. There is only 1 anomalous point here, for the mass after 30 minutes, probably because excess solution was not dried.
Now that I have made graphs which tell me the rate of osmosis in each solution (found by finding the gradient of the line), I can now make a graph which tells me the rate of osmosis in the different sucrose solutions, to see if I get the results I expected in my hypothesis.
This graph tells me that the concentration of water in a potato is 0.2M. I know this result is wrong, because it has been proved by scientists to be 0.27M, so I will justify my wrong results in my evaluation.
The curve is basically what I expected, but not very accurate, because the line is meant to start steep, and then plateau out, but this graph starts out steep, then plateaus, then turns steep again and then plateaus out again. This is because the rate of osmosis in the 0.4M solution is anomalous, probably because I didn’t dry off excess droplets of solution of the potatoes. Otherwise, the graph is fairly good in depicting what I expected. This line basically does what I expect because after a certain concentration gradient, the rate of osmosis can’t increase anymore, because there are only a limited amount of pores in the potato, therefore the rate can’t keep infinitely increasing, which is why the rate plateau’s out.
Evaluation
The final results and graphs from this investigation were almost or as I wanted and expected them to be. They would have been more accurate with a bit more preparation time and planning.
The fact that I tried to dry and measure all 6 pieces of the potato at once probably was the main set back to my experiment. I was unable to do this so the time difference between each weighing was probably as big as 2 minutes that would have made a definite impact on the results, because a lot of osmosis can occur if 2 minutes go by. Also, leaving the potatoes in the open for 2 minutes extra would have caused evaporation from the potato, which means the potato would lose extra mass, which could add to my anomalous results.
The best way I probably could have made up for this is by putting the potato into the solutions with two minute interludes from the start, giving me time to prepare to dry and weight the next piece of potato when the time came. It would have been a lot better that way. Other ways of solving this problem would include being in a group of 6 when changing doing the experiment so each person could weigh one piece each at the same time, but, to do this we would require 6 separate scales so I think the best solution is the first.
Another problem is trying to cut potato squares into the same sizes. I accidentally cut them into slightly different sizes, which meant that the rate of osmosis can be higher due to a larger surface area of the potato.
I seem to have some anomalous results where I would have expected the mass to go down when it has gone up and the other way round. As far as I can tell this could be due to me over drying one piece of potato or forgetting to dry it at one point. This made a lot of difference to the results graph.
I believe that the line of the graph didn’t cross 0.27 because I didn’t have enough results to make it accurate enough. For example taking the mass of the potato more often than every 15 minutes, say every 5 minutes would make it a great deal more accurate. But this way I would have to think of another way to take reading for the potato, I would have trouble weighing 6 at once.
Rate of reaction from these results wasn’t quite what I expected, the difference in rate of osmosis was not as great I had hoped and the anomalous result made things look very odd on the graph but overall the experiment was as I planned and I got the results I wanted.
I could have furthered this experiment by taking more frequent results, for example, every 5 minutes, and I could have weighed the potatoes until they had been in the solution for a longer time, to find out how long it will take for the potato squares to be in a state of equilibrium.