Acclimatisation time: The yeast will be mixed with the sugar and then left for a fixed amount of time to allow for the yeast adjusting to its new conditions and to produce respiratory enzymes.
Measuring time: The time intervals of measuring the CO2 collected will be kept the same for all repeats. The total time will be 10 minutes after acclimatisation measuring in 1 minute intervals.
Hypothesis
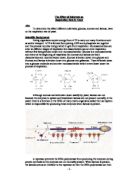
Due to the disaccharides being made of two monosaccharides, they effectively have twice the concentration after being broken down. They produce a glucose molecule and another monosaccharide which enters somewhere lower down in respiration so the respiration rates of these substrates should be much faster maybe up to twice as fast. There may be some time with these disaccharides of lower respiration rates where the disaccharides are being broken down and in the case of lactose, the enzymes required are being produced.
Prediction
The disaccharides will have a higher overall respiration rate than glucose and will have produced more CO2 after the 10 minutes for the experiment.
Safety
Mains voltage electric heating equipment is being used in close conjunction with water; care must be taken when working with this equipment. All chemicals being used are safe so no protective clothing is required. Prolonged exposure and repeated contact with yeast may cause skin and eye irritation. Care must be taken to avoid cross contamination of the chemicals which could affect the results of the experiment.
Preliminary
a) Aim
To determine suitable concentrations and volumes of yeast and the sugar solutions for use in the main experiment and to suggest improvements for the final method.
b) Apparatus
c) Method
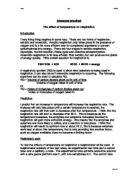
1. Clean all equipment with de-ionised water to avoid contamination which could lead to inaccurate results. Ensure the measuring cylinder is filled to the top with water, otherwise measure the volume of gas in there before carrying out the experiment.
2. Measure out an amount of yeast and a substrate with the syringes and put them in separate test tubes in the water bath so that they can be brought up to the correct temperature.
3. When the solutions are at temperature, mix them together in the side arm test tube and start the timer for the acclimatisation period.
4. After 2 minutes, put the bung in the side arm test tube and restart the timer. After a further 2 minutes reset the timer and start recording the CO2 levels after 5 and 10 minutes. Record the CO2 amount with the volumes of yeast and substrate, the reaction time and substrate used.
5. Reset the equipment and repeat these steps with different substrate and volumes until satisfactory volumes of the yeast and substrate have been found which can be used in the main experiment.
d) Diagram
e) Results
Preliminary Analysis
The initial results show that sucrose is producing more CO2 by higher levels of respiration as predicted however there is a major problem with regards to the respiration rates with the lactose. Sucrose is producing more CO2 than glucose but the difference in CO2 levels is not large enough for it to be of any significance so many more repeats must be made at a higher level of accuracy.
A few problems did arise from the apparatus and method which can be improved upon. The inverted measuring cylinder used to measure CO2 was not very accurate and was messy and tricky to set up which slowed down the process of setting up significantly. The tube underneath the cylinder could also come away which would ruin the experiment so it would have to be redone. Water could also get into the tube which could reduce the flow of CO2 coming out of it which would cause a higher build up of pressure in the side arm test tube. The levels of CO2 recorded because of this would be less than what they should have been. This can be improved by using a gas syringe instead. This will leave a clear path through the tube from where the yeast and substrate are mixed. It is also much easier to set up and all of the connections are fixed so there is no element of leakage.
The side arm test tube also caused a problem. When adding the yeast and substrate, there was a chance that some of it could go down the arm of the test tube and clog up the rubber tube which would cause major problems in the recorded levels of CO2. Mixing the yeast and substrate during the experiment may also be required so that the true levels of respiration are recorded by aiding the diffusion of the chemicals. This would require an alternative to the side arm test tube so that the mixture will not go down the side arm when shaken. A conical flask could be used instead of the side arm test tube. A bung with a delivery tube going through it will also be used in the conical flask so that the CO2 can still be collected.
Final Apparatus
Final Method
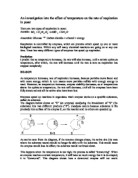
1. Clean all equipment with de-ionised water to avoid contamination which could lead to inaccurate results. Reset the gas syringe by putting it back to 0 cm3.
2. Measure out 10cm3 of yeast and 5 cm3 of a substrate with the syringes and put them in separate test tubes in the water bath so that they can be brought up to the correct temperature.
3. When the solutions are at temperature, mix them together in the conical flask and start the timer for the acclimatisation period.
4. After 2 minutes, put the bung in the conical flask and restart the timer. After a further 2 minutes, reset the timer and gas syringe then after every minute up to and including 10 minutes, record the CO2 amount with the volumes of yeast and substrate, the reaction time and substrate used.
5. Reset the equipment and repeat the experiment with the same substrate and different substrates until at least 5 repeats for each substrate have been done.
Final Diagram
Results
Analysis
The table shows the CO2 collected at certain time intervals during the experiment. It is opposite to what is predicted which was both sucrose and lactose producing more CO2 than glucose. Lactose did not produce any CO2 from respiration after the acclimatisation period which would suggest it had an inability to break down lactose. This suggests that either the Lac Operon was not present in this sample of yeast or that there was not enough time given for the Lac Operon to operate.
The prediction suggested that glucose would have a higher initial rate of respiration due to the fact that the yeast does not have to break it down before respiring it. This could also suggest that not enough time was given for the experiment and that sucrose may have produced a much higher amount of CO2 than glucose if left for longer. The shape of the graph shows that the gradient of the line of best fit is increasing which shows the rate of respiration is increasing. This shows that it was only the beginning of the reaction as the rate of respiration was increasing. This could be because the substrate is being absorbed into the cell increasing the concentration in the yeast cells.
The Mann Whitney-U Test can determine if these is a significant difference between the results. Two hypotheses are chosen for if the results have a significant difference or not.
Null Hypothesis: There is no difference of rate of respiration for yeast with different substrates.
Alternative Hypotheses: This is a difference of rate of respiration for yeast with different substrates.
For this test I will ignore lactose for the fact that there was an obvious significant difference which will be evaluated separately.
R = 35.5 (Sum of ranks for lesser substrate)
n1 = n2 = No. of results for substrate. = 6
U = n1n2 + n1(n1 + 1) / 2 – R
U = 6*6 + 6(6+1)/2 – 35.5 = 21.5
U’ = n1n2 – U
U’ = 36 – 21.5 = 14.5
U’ < U therefore U’ is used.
Ucrit for 6 + 6 set of results = 5
U’ > Ucrit
14.5 > 5 therefore the values are not significant enough so accept Null Hypothesis.
These set of results are not significant for P > 0.05 so there is no difference of rate of respiration for yeast with different substrates.
Evaluation
It is obvious that this experiment was not carried out perfectly and there are many improvements that could be made. First of all, there is a major anomaly with a set of results for sucrose which is highlighted on the table of results. The levels of CO2 for this particular set of results were much lower than the others which suggests that there was a problem with that particular experiment. This could have been caused by a blockage in the rubber tube or in the air syringe, or possibly an error in the mixture of the yeast and substrate used. This set of results was rejected and not included in the averages taken.
There was also a major flaw in the fact that the yeast could not respire lactose. This could have been due to many factors such as the absence of the Lac Operon or there was not enough time given for the Lac Operon to work. An improvement to this would be to leave the experiment to run for a much longer time and to try to use a different sample or species of yeast which may have the Lac Operon present.
Due to the fact that the results for sucrose where much lower than predicted, there could have been a problem with the method. This could be that the time for the experiment was not long enough. This shape of the graph suggests this as the gradient was getting steeper and not starting to reduce and level off which it will do as it gets to its maximum respiration rate and then runs out of substrate to respire. Extending the time of the experiment would be a major improvement and may show the results with a much higher significance than what was found in the Mann Whitney-U test.
There are many improvements that could be made to the equipment and method which are listed below.
There were also problems with the methods and techniques which could also be improved. Here is a list of these problems and possible improvements.
Six repeats were taken for each substrate so that anomalies could be found and removed. This made the results more reliable and suggested that there was an obvious trend to the results as shown by increasing amounts of CO2. The preliminary showed a trend line which was of a similar shape to the results found however it could have been extended to show a longer time allowed for the reaction which would have shown a more thorough prediction.
Bibliography
Respiration Information
Advanced Sciences – Biology 1 - Mary Jones, Richard Fosbery, Dennis Taylor.
Lac Operon, Respiration and ADP/ATP Information
Advanced Sciences – Biology 2 - Mary Jones, Jennifer Gregory.
Lac Operon Diagram and Information
Sugar Diagrams and Information
Mann Whitney-U Test Information
- 2,607 Words (not including tables) –