Prediction:
I predict that our results from this experiment will tell us that the higher the concentration of sucrose is, the higher the rate of osmosis will be. Although a higher percentage of sucrose in the solution will mean a loss in mass, the actual rate of osmosis will still be higher because the more sucrose you add to the solution, the weaker it becomes. Therefore there will be a higher concentration in the potato cell and the water particles will travel to the sucrose solution. If we have less sucrose in a solution, the potato cell will gain mass because the solution will be of higher concentration than that of the potato. Therefore the potato will take in water, but not as fast as it would when giving out water because of high sucrose concentration.
Fair Test:
In order to make this experiment fair we need to keep certain variables the same every time we do a test. Variables which we need to keep the same are:
- Time in which change of mass is measured
- Shape of potato
- Starting mass of potato
- Temperature
- Volume of sucrose solution used each time
If these variables are not kept the same it would influence our results and make them inaccurate.
However, we will also be changing some variables to enable us to obtain the results we need. We will be changing the concentration of sucrose in the sucrose solution, so that we can see how the change in mass varies depending on the concentration of sucrose in the solution.
Safe Test:
There are also certain things that we must ensure that we do in order to keep ourselves safe during this experiment. They are as follows:
- Wear safety goggles at all times.
- Tie back long hair.
- When picking up bottles of acid, never hold by the lid.
- If you get anything on your hands wash it off immediately.
- Stand up when doing an experiment.
- Never put anything in your mouth when in the lab.
- Roll up long sleeves.
- Report any accidents to the teacher.
These rules will make sure that we are safe in the lab and accidents and hazards can be avoided.
Preliminary Investigation
Aims:
To decide which is the appropriate time to use when measuring change in mass, what shape of potato works most effectively, and what range of sucrose concentrations to use.
Choosing the time
Method:
- Set up apparatus needed in preliminary work.
- Measure out 25cm³ of pure (distilled) water and pour into a test tube.
- Measure out 25 cm³ of 80% sucrose solution and pour into a second test tube.
- Cut out two chunks of potato, measuring them to make sure they are the same mass.
- At the exact same time, drop a chunk of potato into each test tube and start the timer.
- At regular intervals (e.g. every 5 minutes) stop the timer, and check the change in mass for both potato chunks. Do this for an hour until you have all your results.
- Choose the most effective time to use.
Results:
We have chosen to use 30 minutes for our immersion time because it showed the largest mass change in both pure water and 80% sucrose.
Choosing the shape
Method:
- Set up apparatus needed in preliminary work.
- Measure out 25cm³ of pure (distilled) water and pour into a test tube.
- Measure out 25 cm³ of 80% sucrose solution and pour into a second test tube.
- Cut out two fat cylindrical shapes from the potato of the same mass.
- Drop one in each test tube and time for 30 minutes.
- Record results of change in mass.
- Repeat steps 2 to 6 using a cube shape instead of a fat cylinder.
- Repeat steps 2 to 6 using a cylinder shape.
- Choose the shape that gives the best results.
Results:
We have chosen to use the cylindrical shape because it shows a good amount of change in mass in both pure water and 80% sucrose, and the results show that it is a relatively equal change in mass in both solutions.
Choosing the concentration range
Method:
- Set up apparatus needed in preliminary work.
- Measure out 25cm³ of sucrose solution with a concentration of 0.01%.
- Using your chosen shape of potato cut a chunk out and drop it into the solution.
- Time for 30 minutes then measure change in mass and record results.
- Repeat steps 2 to 4 using concentrations 0.1%, 1%, 10%, and 80%.
- Choose the most effective concentration and centre your range on it.
Results:
*Anomalous result
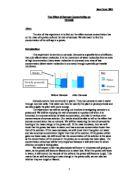
We have chosen to use a range of results going from 5% to 15% sucrose. We have chosen this range of concentrations because we want to find the sucrose concentrations nearest to that of the actual concentration in the potato. To do this, we need the percentages that are nearest to 0. From the table above, we can see that at the concentration of 1% sucrose, the potato gained 0.14 grams, and at 80 it lost 0.12 grams. We can assume that the potato will be losing mass, or at least gaining very small amounts of mass at 10% sucrose. Therefore we want concentrations above 1% and close to 10%.
The Effect of Sucrose Concentration on
Osmosis
Method:
I will be using a specific method when carrying out this investigation, so that I can ensure I know what I am doing and when. This method is as follows:
- Set up apparatus needed.
- Measure out 25cm³ of one of the chosen concentrations and pour into a test tube.
- Cut out chosen shape of potato, measure on a top pan balance.
- Drop into sucrose solution and time for 30 minutes.
- After 30 minutes, measure change in mass and record results.
- Repeat another two times for accuracy.
- Repeat steps 2 to 6 with all other chosen concentrations.
If this method is followed strictly then our experiment should be successful in gaining the information we need.
Apparatus:
In this investigation I will need to use various equipment set out in a specific way. The apparatus I will use will be:
- Test tube (or boiling tube) x 6 – as I will be testing 6 concentrations at one time to save time.
- 25cm³ of Sucrose Solution, 6 different concentrations
- Timer
- Top pan balance
- Potato
- Carver (for potato)
- Teat pipette
- Tweezers
- Test tube rack
The diagram below shows how this apparatus should be set up:
Results:
Below are various tables showing the results we found when carrying out our investigation. We tested each concentration of sucrose solution three times, and have found an average from these results. Below is a table of our results from this investigation.
Anomalous = These results do not fit in with the other two tests; they were most probably taken down incorrectly. Therefore, I have decided to discount them from the mean change in mass, as it would make the results unfair and misleading.
Below is a graph that shows the results I gathered when carrying out this investigation:
On the graph above we can see that the test 1 results are anomalous, as they do not fit in with the general trend of the rest of the results.
Below is another graph which shows the average change in mass of the potato during osmosis:
Conclusion:
We can gain much information from both of the above graphs. They show that there is a rapid decrease in mass in the potato from 5% sucrose solution onwards. Although it starts off gaining in mass, it soon begins losing mass from about 6% sucrose concentration onwards. This tells us that just after 6% sucrose solution, the direction of osmosis in the investigation turns from being from the solution to the potato, to going from the potato cylinder to the sucrose solution. As the water particles pass out of the potato, it begins to lose mass. The graphs also tell us that at about 6% sucrose concentration the potato is neither gaining nor losing mass. That means that the concentration of sucrose in the potato is most probably 6%, as no osmosis is taking place.
We know that osmosis is the movement of water molecules from an area of high concentration to an area of low concentration through a semi-permeable membrane. When osmosis occurred in this case, the water molecules moved from the potato to the sucrose solution. The water molecules made up a large part of the mass of the potato. This is why the potato lost mass during osmosis, as it lost many water particles.
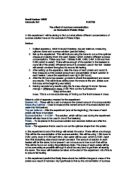
When there is no mass change in the potato, it means that the concentration of the sucrose solution and the concentration within the potato itself are equal. Because one is not of higher concentration than the other, the water particles do not need to pass through the semi-permeable membrane to the area of lower concentration. This is shown in the diagram below:
In this diagram both solution A and solution B have the same number of water molecules, therefore one concentration is not higher than the other, and osmosis does not take place.
I predicted that the higher the concentration of the sucrose solution was, the higher the rate of osmosis would be. Our investigation has proved this to be partly true. However, a more accurate prediction would have been “the higher the concentration of sucrose in the solution, the larger the loss in mass in the potato”. Although the rate of osmosis was higher as the concentration increased, it was also a high rate of osmosis when the concentration was lower, but in the reverse direction. For example, although when the concentration was 15%, the potato lost 0.15 grams and the rate of osmosis was high, if we had used a concentration of 1%, there would have been a gain in mass, most probably of the same rate as the 15%. Therefore, although I was partially correct in my prediction, it would be easier to be more specific when thinking about the outcome.
Evaluation:
If I were to do this experiment again, I would be incredibly careful to follow the method strictly. As the investigation can be altered greatly by the smallest of mistakes, it is vital to be very accurate and concentrate wholly when carrying it out. Some of my results did not fit in with the general trend of the rest of the results. This is most probably because I was not careful enough when carrying out the experiment, and may have put in too little or too much of a variable.
However, I believe we did do enough tests of our investigation (three) as it is much easier to clarify the best results, and if an anomalous result does appear (as in our case) you have more results to use to check it.
Our immersion time was also adequate, as we were able to find the information we needed from it. It made sure that we got a wide enough range of results, but was not too long, as we were able to complete the experiment easily.
When we were doing our preliminary experiment, some of the potato cylinders did sink to the bottom of the test tube, making them hard to retrieve when the time came to measure the change in mass. This could be avoided in the future by making the potato cylinders smaller so that they could float in the solution.
To extend this study, there are other investigations one could carry out. To find out about osmosis in plant roots and cells, you could do a detailed study over a period of time measuring the change in mass of a plant potted in some soil. To do this you would need to take a cutting from a plant (including the roots) and measure its mass at the start. Then you would plant this in a small pot of earth with a certain amount of water poured over it. This would need to be covered during the investigation to stop the water from evaporating away. The water would merely re-circulate if it had nowhere else to go. A specific environment would need to be maintained in order for the experiment to be successful. The amount of water would need to be decided on and kept the same throughout the experiment. After a fixed period of time, longer than in this investigation of course, you would take out the plant and measure the change in mass. This would tell us more about osmosis and how it works in plants, including the rate of osmosis in plants.