Borer – The apparatus that is used to cut out the cylinder shape from the potato.
In this experiment most of the things will remain the same. There will be one change. This will be the concentration of the sucrose solution. We will be using 1.0M down to 0.2M, going down in 0.2M each time. Also water will be used, which is 0.0M. Apart from that everything else should remain constant. The amount of solution in each beaker will be the same, but at present I am not sure as to how much that will be. This will be found out during the preliminary trials. The mass of each potato will be cut as accurately as possible although it would be very hard to get them all exactly the same. The mass will therefore be taken at the start of the experiment. All of this is to ensure fair testing.
In this experiment predict that firstly there should be definite changes in mass of the potato as a result of osmosis. My hypothesis is that as the concentration of sucrose solution increases, the mass increase of the potato will decrease. This is because as we know, be definition osmosis is the movement of water particles from a high concentration area to an area of low concentration. It is a way of ‘balancing out’. So basically the very concentrated sucrose solution such as 1.0M will not have much water, and the potato will so the water will osmose from the potato to the solution. This will be reverse for more dilute solutions such as 0.2M, when the potato will gain water as opposed to loosing it. I also predict that one potato will remain fairly unchanged because the water in the solution and the water in the potato will be roughly equal.
(Image from - )
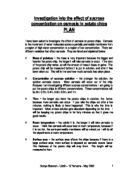
Also during this experiment I will be plotting a graph after all my results have been obtained. This graph will look something like this…
Point where sucrose concentration in potato is equal to the sucrose in the solution
The reason the graph looks as it does is because some of the potato will gain mass whilst others will lose mass. The point where the line crosses the x-axis is where the sucrose concentration in the potato is equal to the sucrose in the solution.
Before the final experiment can be carried out, we must first do a preliminary experiment. This is to find out whether our strongest and weakest sucrose solutions will provide a suitable range for the experiment. What we are aiming to find out is that 1.0M will remove water from the potato and 0.2M will increase the amount of water in the potato. This will happen as a result of osmosis, so the water in the potato will osmose into the very concentrated solutions thus loosing mass and on the very dilute solutions the potato will gain mass as the particles go into the potato. The preliminary experiment is not the final experiment. It is purely to find out what strengths of sucrose solutions will be most suitable for the experiment.
Having done the preliminary experiment I have decided to use the concentrations of 1.0M down to 0.0M (water) going down in 0.2 each time. 1.0M 0.8M 0.6M 0.4M 0.2M 0.0M.
Now that I have obtained my results I am able to work out the %mass change in the potato, using the formula:
% Mass Change = Difference in mass X100
Mass at start
% Mass Change:
0.0M +28%
0.2M -11%
0.4M -24%
0.6M -66%
0.8M -58%
1.0M -49%
Having now obtained all my results and my graph has been drawn (see overleaf), I am able to comment on what is shown by the evidence. First of all it is evident that the curve on my graph is not as it should be in relation to my prediction. Obviously from the graph and results the mass was affected. In some solutions the potato lost mass whereas in others it gained mass, this was all as a result of osmosis. Having looked at my graph it fair to say that as the molarity of the sucrose solution increased the mass of the potato decreased at a steady rate until 0.6M when it began to increase slowly. All of my results except the potato which was in water, lost mass. I am not sure why this may have happened. The results are not as I predicted because I would have thought that there would have been more potatoes which increased in mass.
The aim if this experiment was to find out the effects of sucrose solution on osmosis on potatoes. I can conclude now having analysed my results that as the concentration of the sucrose solution increased the mass of the potatos decreased. The potatoes gained mass in the more dilute solutions. This is what I predicted. Reasoning for this is becase as we know the mass of each potato was affected due to osmosis. Osmosis is the movement of water particles from an area of high concentration to an area of low concentration. So in relation to this experiment the concentration of water in the potatoes was higher then the concentration of water in the very concentrated solutions and opposite for the more dilute solutions.
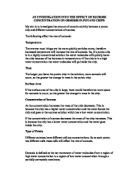
Below the potato will gain mass
Dilute Solution Dilute Solution
Below the potato will lose mass
Concentrated solution Concentrated Solution
I said before that the results did not match my prediction. In some ways this is true, however on general terms my prediction did match my results. I predicted that firstly there would be a definite change in mass of each potato. Evidently that was true because the table of results shows that every potato either increased of decreased in mass, although I did also predict that one of the potatoes would remain unchanged because the concentration of water particles in the potato would be equal to the concentration of water particles in the sucrose solution. With reference to my results this is not true. I predicted that as the concentration of sucrose solution increases the mass increase of the potato would decrease. Again this was not evident in my results. The potato in 0.0M (water) had a % mass increase of +28% and therefore I expected the 0.2M and 0.4M to have a positive increase in mass. However 0.2M has an increase of –11% and 0.4M of –24%. I think either a calculation went wrong or the experiment did not turn out as planned.
My results seem to be slightly unusual. It is possible that somewhere there was a miscalculation to explain why my results are as they are, or there could have been a fault during the experiment. By looking at he graph it is evident that there is an anomalous result. Whilst the % mass increase of each potato declined at a steady rate, at 0.4M it seemed to increase. This does not fit in with the pattern on my graph after having drawn my line of best fit. There are ways in which anomalous results can be overcome. This is to repeat the experiment more than once. In this experiment it was attempted 3 times, it would be much more accurate and fairer had it been repeated 10 times for example. That would insure fewer inaccuracies.
Although in this experiment there were some anomalous results and unpredicted errors, I think that on general terms you can trust my results. Reasoning for this is because overall I did get roughly what I expected and by going off my graph the line of best fit does fit in with how it should look. I predicted that the potato chips in the concentrated sucrose solutions would lose mass and the potato chips in dilute solutions would gain mass. This did happen as a result of osmosis, thus my results must have been accurate because if not then what I predicted/expected to happen would not have. This experiment opens doors to other related experiments. For example you could investigate osmosis on the same principle of this experiment but by using different solutions and strengths. You could be more accurate in the experiment just carried out and use a lager range of concentration within a certain range. By this I mean instead of using 1.0M 0.0M (going down in 0.2M each time) you could use more concentrations such as 0.9M 0.7M 0.5M 0.3M 0.1M etc. Also another idea would to be to use something different to potato chips. Another type of vegetable would be an idea.