The effect of temperature on the rate of an enzyme catalysed reaction
2H2O2 › O2+H2O
Catalase
Apparatus
Bench mat
Goggles
Conical Flask
Graduated pipette
Bung and delivery tube
Syringe
0 cm3 Hydrogen Peroxide
Boss and clamp
Stand
Gas syringe
Ice
Kettle
Potato
Borer
Stopwatch
50 ml beaker
2*250ml beaker
Thermometer
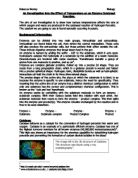
We are looking at the effect of catalase (in potatoes) on Hydrogen Peroxide to find the effect of temperature on the rate of an enzyme-controlled reaction. Oxygen gas will be produced therefore we can measure the volume of oxygen produced, and compare the rate which is produced at different temperatures to see the effect that changing temperature has on the rate of reaction. I will obtain my results by measuring oxygen evolution in cm3 over various temperatures. If graphs are produced we can measure the gradients of the graphs and we will obtain values for the rates of reaction, which can then be plotted on a separate graph.
I will use a range of temperatures of 10, 20 30, 40, 50 and 60oC to give me a wide range of results which will help me find the results for my task. Any anomalous results should be repeated to check that they are correct. Hopefully the experiment shall be repeated 3 times at least so that I can obtain an average set of results to minimise the effect of any uncontrolled variables.
2H2O2 › O2+H2O
Catalase
Apparatus
Bench mat
Goggles
Conical Flask
Graduated pipette
Bung and delivery tube
Syringe
0 cm3 Hydrogen Peroxide
Boss and clamp
Stand
Gas syringe
Ice
Kettle
Potato
Borer
Stopwatch
50 ml beaker
2*250ml beaker
Thermometer
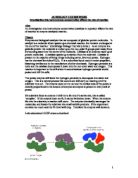
We are looking at the effect of catalase (in potatoes) on Hydrogen Peroxide to find the effect of temperature on the rate of an enzyme-controlled reaction. Oxygen gas will be produced therefore we can measure the volume of oxygen produced, and compare the rate which is produced at different temperatures to see the effect that changing temperature has on the rate of reaction. I will obtain my results by measuring oxygen evolution in cm3 over various temperatures. If graphs are produced we can measure the gradients of the graphs and we will obtain values for the rates of reaction, which can then be plotted on a separate graph.
I will use a range of temperatures of 10, 20 30, 40, 50 and 60oC to give me a wide range of results which will help me find the results for my task. Any anomalous results should be repeated to check that they are correct. Hopefully the experiment shall be repeated 3 times at least so that I can obtain an average set of results to minimise the effect of any uncontrolled variables.