Step-By-Step Method:
- To begin with, I will stick labels on my 5 test tubes, each with a different concentration written on it: 0 molar, 0.5 molar, 1 molar, 1.5 molar, and 2 molar.
- I will fill each test tube with a volume of ??? of the 5 appropriate concentrations of sucrose sugar solutions, according to what is written on the label. (e.g. if the label on the test tube says 0.1M, then I will put ??? of the 0.1 molar sugar solution in this test tube. The 0 molar is just distilled water.)
- I will use the borer to carefully cut 5 pieces of my potato (I may need more than one potato if it isn’t big enough). I will then cut the 5 pieces to the same size using the knife and a ruler. This part of the preparation must be done very accurately as an unconsistant surface area for all of my potato chips may allow more or less osmosis to occur in certain chips. I will also make sure that all my potato chips have no skin, which will make them all the same and therefore make the experiment fair.
- Once all the potato chips are the same size, I will draw up a rough table. I will weigh each potato chip and record the mass of each chip before I do the experiment. I will then record the length of the potato chips too, as this will mean that more results can be obtained from the experiment.
- I will put one potato chip in each of my test tubes, and leave them there for ???
- After ???, I will remove the potato chips from the test tubes and place them in a line on the paper towel, in the order of lowest concentration to highest concentration so that I don’t get them mixed up.
- I will weigh each chip and record the weights in my table.
- I will then measure each chip with the ruler and record each length in my table.
- I will empty out my test tubes, clean them and dry them, and then repeat steps 2-8, so that I can find some average (and hopefully more reliable) results.
Prediction:
I predict that the more dilute (the solution with more water than sugar in it) will result with the potato’s mass increasing. I base this prediction on the knowledge I have of osmosis.
Osmosis is defined as the net movement of water or any other solution’s molecules from a region in which they are highly concentrated to a region in which they are less concentrated. This movement must take place across a partially permeable membrane such as a cell wall, which lets smaller molecules such as water through but does not allow bigger molecules to pass through. The molecules will continue to diffuse until the area in which the molecules are found reaches a state of equilibrium, meaning that the molecules are randomly distributed throughout an object, with no area having a higher or lower concentration than any other.
Knowing that osmosis will occur across a semi-permeable membrane whenever there is a difference between the water concentrations on the two sides of the membrane, and knowing that when this happens to cells they will either become turgid if water flows into them, or plasmolysed if water flows out of them, I want to test this theory: If the concentration of a solution in which the potato chip is placed is greater than a certain level the chip will contract, and if the concentration is less than that level it will expand. This can be seen in living cells. The cell membrane in cells is semi-permeable and the vacuole contains a sugar/salt solution. So when a cell is placed in distilled water (high water concentration) water will move across the semi-permeable membrane into the cell (lower water concentration) by osmosis, making the cell swollen and hard. The cell is now referred to as “turgid”. The pressure inside the cell rises and eventually the internal pressure of the cell is so high that no more water can enter the cell. This liquid or hydrostatic pressure works against osmosis.
When this is done with the potato cells, the cells will increase in length, volume and mass because of the extra water. However, when these potato cells are placed in a solution with a low water concentration, the opposite will happen. Water will move out of the cell into the solution, which means they have lost water by osmosis and become “flaccid”. This is the exact opposite of “turgid”. The contents of the potato cells shrinks and pulls away from the cell wall. These cells are said to be plasmolysed.
The potato cells will have decreased in length, volume and mass.
When plant cells are placed in a solution which has exactly the same osmotic strength as the cells, they are in a state between turgidity and flaccidity. We call this “plasmolysis”. “Incipient” just means “about to be”.
In summary; the greater the concentration of water in the external solution the greater the amount of water that enters the cell by osmosis. The smaller the concentration of water in the external solution the greater the amount of water that leaves the cell. However, there will be a point where the concentrations of water inside and outside the potato cells are equal (isotonic). At this point there will be no change in the length, volume or mass of the potato, as the net movement of water will be zero; no osmosis has occurred.
Conclusion:
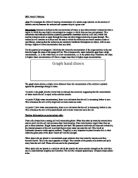
My graph gives the line of best fit for the percentage change in mass of the potato chips over the course of the ??? long experiment. The graph is a curve that slopes downwards and does not go through the origin. Because the line is straight and does not pass through the origin, it means that the percentage gain and loss in mass and concentration are not directly proportional. However, there is a pattern on my graph, and this is, as the concentration of the solution increases, the percentage change in mass decreases. The graph shows that the gain and loss is inversely proportional to the concentration. The gradient does not change in my graph. It gets less steep as the X axis gets bigger. This is because the potato chip is become as flaccid as it possibly can, and so the change in mass of each molar concentration is becoming closer and closer together. From the line of best fit that has been added in, it can be seen that all of my points were very close to creating a perfectly smooth curve. This shows that my results are fairly reliable. My graph fits in with my prediction.
It shows that the potato cells increase in mass solutions with a high water concentration and decrease in mass in solutions with a low water concentration. When the concentration reaches above 0.75 M, there appears to be no further water loss, suggesting that the cell is fully plasmolysed. From the graph an estimate to the concentration of the potato cell can be made as 0.13 M, as this is the point where the potato is not increasing or decreasing in mass. This is known as the isotonic point. This is where no osmosis is taking place, both the potato and the solution have an identical molar concentration. The next point, 0.25 M looses approximately 4.0%. This shows that the water potential of the salt solution in the test tube is weaker than that of the potato chip. The next, 0.50 M, looses approximately 8.0% in mass. This shows that the salt solution has an even weaker water potential than 0.25 M and that osmosis took place. This is why the potato lost even more mass, and it shows that the water potential in the test tube is less than that of the potato chip. This pattern carries on through the graph, and even more mass is lost, as more water moves out of the potato into the solution. My results also match with my initial predictions.
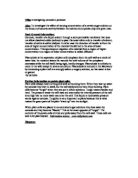
This graph of the change in mass helps prove the point of complete plasmolysis, whereby the potato cannot expand and take in any more water. As you can see, as the molar concentration increases the change in mass decreases. From right to left the first two points on the graph are very spread out indicating that there was a large change in mass. This decreases throughout increasing the molar concentration until the change is minuscule (about 0.02g).
This graph shows a clear indication that there was an overall decrease in mass during the experiment. At the point 0.00 M the line for after the experiment is above the line for before the experiment unlike any of the others. This is because the water potential of the sugar solution is higher that than of the potato chip.
Evaluation:
My experiment was very successful in my opinion. I obtained a large quantity os very accurate results from which I was able to create informative graphs. I think I took easily enough results for the amount of concentrations that I was using, and the time that I used for the experiment to last was enough to allow sufficient osmosis to occur. However, if I was to repeat the experiment I might try to find out the saturation point of the chips. The range of concentrations was adequate but I would possibly create more concentrations of I repeated the experiment so that I would have more varied results, i.e. 1.10M, 1.15M, 1.20M, and so on. This way would have allowed me to also find out the isotonic point far more accurately as the one that I estimated is very approximate.
The cutting of the potatoes was the most difficult part of the experiment because although I was recording my results by mass, it could well have affected the surface area and so the overall rate of osmosis. I could also weigh each chip on a more accurate scale, e.g. not to 0.00g but to 0.000g.
There were not any anomalous results, but some were not as close to the line as others. This may have been caused by human error. When the potato chips were removed from the test tubes I may have dried some potatoes more thoroughly than others on the paper towel and so some would have more excess water, which would add to the mass.