The fourth factor is to add a catalyst, but in this experiment we did not add a catalyst.
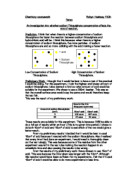
Knowing the collision theory, it makes my predictions clearer with what is going to happen when the experiment will take place. So, if I have a large volume of sodium thiosulphate and hydrochloric acid, and a small volume of water, then the concentration is high, and the collisions would be more frequent, resulting that the reaction rate would be fast. On the other hand if there was the opposite, and having more water and less sodium thiosulphate, then the collisions would occur less because the water is neutral and the process of the reaction would be slower.
The equation for this reaction is:
Hydrochloric + Sodium Sulphur + Sodium + Sulphur + water
Acid thiosulphate Chloride dioxide
2hCl (aq) + Na2S2O5 (aq) S (s) + 2NaCL (aq) +SO2 (g) + H2O (l)
To keep it a fair test
I will try to keep the experiment fair by the following:
- To carefully measure the exact amount of sodium thiosulphate, water and the acid.
- To make sure the results are accurate, with stopping and starting the stop clock
- To add the acid into the conical flask first, and the water, and sodium thiosulphate at the same time, second.
- After each experiment I will clean the conical flask, so the results can be fair.
While carrying out the experiment I will always need to think of them points if I want to keep the experiment exact and accurate. If I don’t, then the readings from the stop clock would be wrong, and there would be a lot of anomalies. It is these anomalies that I should try to avoid.
Safety precautions
In this experiment, because I will be handling with liquids such as acids which is an irritant, to get it in the eyes would be very dangerous so you must always be wearing safety glasses, and to wash your hands or any areas of the skin if you do get in contact with it.
You should always follow the rules that are found in the lab room. They should be the regular rules that tell you to not run around the lab, and to always wear safety glasses while carrying out an experiment, and to not leave any items on the floor that you might trip up on. Also, do not leave glass objects near the edge of the table because they could easily roll on the floor and smash. Not following these could be quite dangerous, so you must be careful at all times.
The experiment
Equipment used:
- Measuring cylinder
- 50ml of sodium thiosulphate
- 40ml of water
- 30ml of hydrochloric acid
- A card with a cross in the centre
- A conical flask
- A stop clock
- Safety glasses
Method
- Measure 50ml of sodium thiosulphate in a flask, and 5ml of hydrochloric acid in a different flask.
(Remember that the acid is an irritant, so be careful when measuring it into the measuring cylinder, and always wear safety glasses.)
- Place a conical flask on a piece of card with a cross on the centre, and when you have finished pouring the liquids into the flask, start the stop clock.
- Measure the time it takes for the cross to disappear, and write it down in a results table.
- Do the experiment again, but this time change the volume of sodium thiosulphate and water, but keeping the volume of hydrochloric acid the same.
- Each time you do the experiment again, make sure you clean the conical flask. If it isn’t cleaned properly the results may not be accurate.
Results
Conclusion
From looking at the graph of my results table there is a slow increase at first from the first experiment. There is a slow increase from the second last reading of the first experiment. It goes from 73 seconds to 189 seconds for the reaction. This is quite strange because of the high difference so it must be an anomaly because on the graph a curve doest fit the 3 last points together. This probably happened because I didn’t clean the beaker properly, and there must have been remains of water in the beaker. Or I did not measure out the water, sodium thiosulphate or hydrochloric acid accurately. Because of this, the line doesn’t fit the points on the graph that should look like a curve and it means in the overall three experiments I carried out there was only one anomaly.
In the third experiment what’s different from that one to the others is that at the beginning there is a steep curve. This is because the second point had a fast collision speed resulting in a fast reaction speed like the first point. There is only a difference of 2 seconds.
My predictions that I had before I carried out the experiment match my results. The reaction was faster when there was a small volume of water, and more sodium thiosulphate and hydrochloric acid. This is because of the particles that are colliding together. And as there was more water than sodium thiosulphate, the rate of reaction was slower.
The result that I have provided from all three experiments does indeed support my conclusion because there was only one anomaly in all three of the experiments I carried out.
My evaluation
While carrying out all the experiments I think I had done quite well in trying to keep the test fair. I did the experiment three times to have a variety of results in case one of them had gone wrong or had a lot of anomalies. There was however, one anomaly and it was from the first experiment. I corrected my mistake, and the other two experiments came out reasonably well.
To improve the experiment I think I could have had a preliminary experiment, to give me a rough idea what would happen in the experiment. That is also another reason why I carried it out three times to give me a better idea.
To take the investigation further, I think I would have taken more readings to show exactly the shape of the curve on the graph. Instead of having 60ml, 50ml, 40ml etc, I would have 60ml, 55ml, 50ml, 45ml, 40ml etc. This would then give me 12 readings on a graph for three experiments, and could help me see the exact shape of the curve near a peak or dip.
There are a few advantages to doing this.
- There would be more readings which would give better evidence to my prediction.
- It should show a perfect curve in the graph if the experiment was carried out correctly and accurately.
There are also a few disadvantages to doing this. And they are:
- On the graph because there are more points it could look a little untidy.
- The experiment would take longer to carry out.
Overall, I am quite happy with my results and the experiment that I carried out, because it proves my prediction before the experiment and it shows that knowing the collision theory, you can estimate what will happen in an experiment.