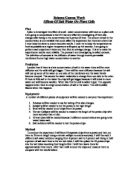
Each dish was labeled with the appropriate sugar concentration so that they could be easily identified. The cucumber plant was then sliced using the machine cutter to obtain thin even slices. This helps to ensure fair testing because surface area might affect osmosis. Two slices were cut for each petri dish used, so each petri dish will have two slices labeled A and B. The slices were then immediately massed and placed into the Petri dish (do not leave them on a piece of paper before putting them into the dish because the paper will absorb some of the water, thus changing the slice’s mass). The masses for each cucumber slice were recorded in a table (see table of results).
The cucumber slices were left in immersion for 10-15 minutes, long enough for there to be a significant change in mass. The time of immersion must be kept the same throughout the experiment. When the time is up, each slice must be removed from the dish, dried and massed. Tissue was used to dry the slices. They were only quickly wiped on both sides to remove the surface droplets of the solution, if left too long the tissue paper would absorb all of the solution in the slice. Once massed, the masses should be noted down in the table along with the change in mass: original mass – mass after immersion in solution, and the percentage change in mass: change in mass / original mass x 100.
Following the preliminary experiment, it was decided that a smaller yet more precise range of sugar solutions was to be used as some results using higher sugar concentrations were anomalous. For the main experiment, 6 readings from 0.1M to 0.5M were taken. This range of results should be sufficient enough to spot a trend in.
The whole experiment was repeated 3 times to increase reliability. Repetition makes the experiment more accurate and the more it is repeated, the easier it is to spot a trend because if a graph were to be drawn, more points would be plotted and a pattern between these points would be easy to spot..
To ensure fair testing, only one variable should change at one time. Everything must be kept constant except for the solution concentration. This means that the temperature was kept constant and the areas and masses of the cucumber slices were tried to be kept as constant as possible.
OBSERVATION:
The experiment was conducted as shown above using cucumber slices. The results over the three experiments were recorded in the following tables.
Tables of Results:
1st experiment
2nd experiment
3rd experiment
ANALYSIS:
From the results it can be seen that the cucumber slices changed in mass. Some gained mass and others lost mass. Generally, as the sucrose concentration increased, less and less mass was gained until passed a certain point around 0.5M, when the cucumber slice began to lose mass. Graphs were plotted to demonstrate this.
It can be seen from these graphs that the mass of the cucumber slice decreases as the sugar solution concentration increases. There is a negative correlation. This can be explained using osmosis and plasmolysis. When the cucumber is immersed in 0M of sucrose, the water has a higher concentration of water molecules so they diffuse into the cells, resulting in the mass increase of the cucumber slice. When the sucrose concentration is increased, the difference between the water concentrations inside and outside of the cells is not so great so less water diffuses in, making the plant cells turgid. Unlike animal cells, this increase of volume inside the cell will not make it burst because of the plant’s cell wall. There is a point when the cucumber does not change in mass. This is where the curve intercepts the x axis; as shown on graph 3: see . This means that the level of sucrose concentration outside the cucumber cells was equal to the level of sucrose inside the cells. Thus meaning that there was the same amount of water molecules on both sides of the cell membrane resulting in there being no net movement of water molecules. When the change in mass started becoming negative: a decrease in mass, the opposite was taking place. The sucrose solution now had a lower concentration of water molecules than inside the cell; meaning that water molecules inside the cell would diffuse out due to osmosis. This is called plasmolysis and causes the plant to become flaccid (this is what makes a plant wilt when you do not water it).
The same process occurred in the second experiment and it started to take place in the first but the last reading did not correspond to the hypothesis. This reading can be considered an anomaly and will be further discussed in the evaluation.
Therefore, my original prediction has been proved to be correct.
In the different experiments, different values were found for the change in mass. This could be due to an independent variable which is out if our control such as the health of the plant. This will be discussed further in the evaluation.
EVALUATION:
The values obtained were not perfect and never will be under classroom conditions. But the results obtained were accurate enough to be able to prove the initial hypothesis correct.
Mostly, the results collected fitted the trend, but there were some anomalies. These anomalous results were mainly in the first experiment and a few off results in the other two experiments. On the first graph the anomalous results have been circled in green. These results could have been brought about due to many factors, human errors. The cucumber slice might not have been dried as much as the others, the balance might have already had some water droplets left on it from the other slices, thus increasing the mass, the measuring of the sucrose solution might have been inaccurate and the slices might not have been totally immersed in the solution. The other inexact results might have been affected by the slices being left out on a piece of paper before massing (making it dry out) or the cucumber slices being different sizes. From week to week, different cucumber plants might have been used (i.e. maybe one of the cucumber plants was healthier than the other, making its cell structure different and the amount of sugar in the cells would vary from one plant to the next) but this is an independent variable and can not be accounted for contributing to the anomalous results.
The experiment could have been improved by using a wider range of sucrose solutions, by measuring the amounts of water and sugar in the solution more precisely, by trying to keep the size and masses of the cucumber slices similar because the surface area of the slice might have an effect. Also more precise timing of the slices in the solution would be necessary to make this experiment more precise.
The third experiment was the most reliable considering it did not have many anomalies and it fit the hypothesis correctly. It was also done having experienced what went wrong in the last two experiments and corrected those faults. As far as repeats are concerned, enough repeats of the same sucrose concentration were taken to make the results credible.
Further relevant work could include an experiment using the same method as this one but replacing the cucumber slices with another plant tissue such as an onion or using carrot slices or chunks. Also, the experiment could have been conducted using a wider range of solutions or over a longer time period.