The Effects of Substrate Concentration on the Activity of Catalase
The Effects of Substrate Concentration on the Activity of Catalase
Preliminary work:
Prediction:
As the concentration of hydrogen peroxide increases then the rate of reaction (1/t) will increase.
Biological Theory:
Catalase behaves as a catalyst for the conversion of hydrogen peroxide into water and oxygen and is able to speed up the reaction because the shape of its active site matches the shape of the hydrogen peroxide molecule. Below is a diagram showing the lock and key mechanism through which catalase works:
As the concentration of hydrogen peroxide increases, there is more substrate to fit into the active sites of the enzyme, catalase. Also, the chances of the substrate entering an active site will increase. If the amount of enzyme remains constant, the rate of reaction will increase up to a point. The rate of reaction increases until all of the active sites of the enzyme molecule are being used. If excess substrate is added, the rate of reaction will not increase any further because the enzyme is working as fast as it can. At this point, Vmax is constant. Vmax is the maximum rate at which chemical reactions can occur (V = velocity).
The rate of an enzyme controlled reaction increase in proportion to the concentration of the enzyme (assuming there is excess substrate). If substrate is not in excess (e.g. constant) the graph tales off as it comes to a point where the reaction reaches maximum velocity, Vmax.
The chemical equation for the breaking down of hydrogen peroxide into water and oxygen is as follows:
This reaction is performed by two types of reactions called oxidation (losing electrons) and reduction (gaining electrons). Catalase functions by removing an electron from a molecule of hydrogen peroxide (H2O2) to form a water molecule (H2O) and an oxygen molecule (O2).
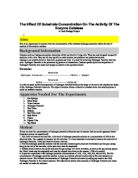
Apparatus:
Eight boiling tubes (four for each experiment)
Diluted H2O2 of concentrations 6%, 3%, 1.5% and 0.75%
Four 25 cm3 measuring cylinders (one for each concentration)
Catalase solution
8 cm3 sodium alginate solution
Glass rod
3 x 50 cm3 beakers (one for catalase solution, one for sodium alginate mixture, one for calcium chloride)
Calcium chloride solution (CaCl)
Pipette
Tea Strainer
Spatula
Stopwatch
Labelling pen
2 filter paper discs (three for each boiling tube)
Metal forceps
Diagrams:
Method:
Experiment 1: sodium alginate beads - immobilised catalase
First add 25 cm3 of H2O2 (of strengths 6%, 3&, 1.5% and 0.75%) to four boiling tubes using a measuring cylinder and label each tube. Then make up the sodium alginate beads by mixing 2 cm3 catalase solution with 8 cm3 sodium alginate solution in a beaker. Mix the substances carefully using a glass rod, making sure to avoid getting any air bubbles in the mixture. Take up some of the mixture in a pipette and drop it one drop at a time into a beaker containing the calcium chloride (CaCl). Stop when roughly 20 drops have been dropped into the CaCl. Leave for two to three minutes to allow the beads to form. Strain the beads into a tea strainer over a sink and then add one bead to one boiling tube using a spatula. When the bead reaches the bottom of the tube or its lowest point start the stopwatch. Stop the stopwatch when the bead reaches the surface of the solution. Repeat this a further two times, collecting the readings for each strength of H202. Lastly, record the results in a table.
Experiment 2: filter paper discs
First, add 25 cm3 of H202 (of strengths 6%, 3%, 1.5% and 0.75%) to four boiling tubes using a measuring cylinder and label each tube. Take a filter paper disc and dip it in the catalase solution. Add the filter paper disc to one boiling tube using metal forceps. When the disc reaches the bottom of the tube or its lowest point, start the stopwatch. Stop the stopwatch when this disc reaches the surface of the solution. Repeat this a further two times, collecting three readings for each strength of H202. Lastly, record the results in a table.
Results:
Strength of H202 solution (%)
Time taken for bead to rise to surface (seconds)
Trial 1
Trial 2
Trial 3
Average
/t - rate of reaction to 2 s.f.
0.75
17.0
33.0
68.5
39.5
/ 139.5 = 0.0072
.50
31.0
21.5
53.5
35.0
/ 135.0 = 0.0074
3.00
40.0
69.0
24.0
44.0
/ 144.0 = 0.0069
6.00
4.5
3.5
3.0
3.5
/ 3.5 = 0.2900
...
This is a preview of the whole essay
Results:
Strength of H202 solution (%)
Time taken for bead to rise to surface (seconds)
Trial 1
Trial 2
Trial 3
Average
/t - rate of reaction to 2 s.f.
0.75
17.0
33.0
68.5
39.5
/ 139.5 = 0.0072
.50
31.0
21.5
53.5
35.0
/ 135.0 = 0.0074
3.00
40.0
69.0
24.0
44.0
/ 144.0 = 0.0069
6.00
4.5
3.5
3.0
3.5
/ 3.5 = 0.2900
Strength of H202 solution (%)
Time taken for filter paper to rise to surface (seconds)
Trial 1
Trial 2
Trial 3
Average
/t - rate of reaction to 2 s.f.
0.75
8.5
4.0
8.0
6.8
/ 6.8 = 0.15
.50
4.5
4.0
3.5
4.0
/ 4.0 = 0.25
3.00
.5
.5
2.0
.7
/ 1.7 = 0.59
6.00
2.0
.0
.0
.3
/ 1.3 = 0.77
Conclusions:
As you can see from the alginate beads graph, the rate of reaction does increase when the H202 concentration increases. However, it does not increase in the way that I would like. For the concentrations 0.75%, 1.5% and 3% the rate of reactions stays about the same, varying from between 0.0069 and 0.0074. This is not what should happen. The 1.5% concentration is twice as strong as the 0.75% concentration so the rate of reaction should be double what it was for the 0.75% concentration. According to the biological theory, the rate of an enzyme controlled reaction increases in proportion to the concentration of the enzyme (assuming there is excess substrate) and this is not the case.
The same should be true for the 3% concentration - the rate of reaction should be double what it was for the 1.5% concentration but again, this is not the case.
The rate of reaction did increase significantly when the concentration of H202 went up to 6% but again, the rate of reaction was not double what it was for the 3% concentration. The rate of reaction was 0.29000, 42 times what it was for the 3% concentration.
The relationship between rate of reaction and concentration should be linear i.e. by doubling the concentration of H202 you double the rate of reaction. This is clearly not what has happened.
When using the filter paper discs, the graph does follow the biological theory more than the alginate beads graph did. At a concentration of 0.75%, the rate of reaction was 0.215. At a concentration of 1.5%, the rate of reaction was 0.25. Although this is not double, it is 1.7 (to 2 S.F.) times as much. The 3% concentrations rate of reaction is 2.4 times (to 2 S.F.) as much as the 1.5% concentrations rate of reaction (0.59 for the 3% compared with 0.25 for the 1.5%) so this to follows the theory more than the alginate beads experiment. Although the rate of reaction for the 6% solution is 0.77, 1.3 times the rate of reaction for the 3% concentration this does mean that my graph started to plateau thereby matching the biological theory.
It can be said then that although the data from the alginate beads experiment does not match the biological theory at all the data from the filter paper discs experiment does to a far greater extent even though my results are not perfect. The data from the filter paper discs then is sufficient to accept my prediction.
Evaluation:
By looking at the graph I got for the alginate beads experiment, it is clear that there are two obvious anomalous results and possibly a third. The results for the concentrations 1.5% and 3% stay roughly the same as they did for the 0.75% concentration when they should not. Also the result from the 6% concentrations 42 times the result I got from the 3% concentration so this may be another anomalous result. I have highlighted these anomalies and possible anomaly on the graph.
These anomalies may be down to the following reasons:
When making the alginate beads, it was hard to get beads of the same size - the drops produced by the pipette would have been different each time. Also, there may have been problems with the hydrogen peroxide, as this would explain why the 1.5% and 3% concentrations did not go to plan at all. When dropping the beads into the hydrogen peroxide, they would have entered it at different velocities and maybe touched the sides of the boiling tube on the way down or up. This could have affected my results in a negative way, affecting how long it took the bead to rise to the surface.
When measuring out the hydrogen peroxide, we used measuring cylinders and it was quite difficult to fill the cylinder up to the 25 cm3 mark accurately. The result of this was that the boiling tubes had different volumes of hydrogen peroxide in so the bead / filter paper disc would take longer to rise in a larger volume and less time to rise in a smaller volume.
For the filter paper discs experiment there is only one result that could perhaps be classed as an anomalous result and this is the result for the 1.5% concentration which is slightly off the curve of best fit. This can be accounted for in the following ways:
The hydrogen peroxide may have decomposed slightly by itself as catalase only acts as a catalyst for its conversion. If it had decomposed by itself, this has had more of an effect on the alginate beads experiment that on the filter paper discs experiment. This is perhaps due to the fact that the alginate beads experiment is more complex and works in a different way to the filter paper discs. For the filter paper discs the catalase is in direct contact with the hydrogen peroxide whereas with the alginate beads it is not.
Also, when placing the filter paper discs in the hydrogen peroxide the discs rubbed against the sides of the boiling tube. With the disc taking a maximum 8.5 seconds to rise any friction caused by rubbing on the sides of the boiling tube would have had a fairly major effect, perhaps slowing the disc down by as much as a second. When the disc rises after about two seconds this may have a serious effect on the quality of my results.
If I did the experiment again I would probably get completely different results for the alginate beads experiment and similar results for the filter paper discs experiment. The alginate beads experiment did not work very well for everyone in the class so this must be down to errors with the equipment provided.
The equipment was suitable for the filter paper discs experiment but not for the alginate beads experiment. With the alginate beads experiment any mistakes with making of the beads would have been exaggerated greatly. It would have been quite easy to produce a bead of roughly 1.5 times the size of an average bead and not realise. Likewise, it would have been easy to produce a bead of 1/2 the size and not realise.
One improvement that could be made to my experiment is to use a burette to measure out the correct quantity of hydrogen peroxide. This would be more accurate than using a measuring cylinder.
I could also be more careful when dropping the bead / disc into the hydrogen peroxide by making sure I was dropping it from the same height each time. Also, I could make sure that I dropped them from the middle of the boiling tube to try to minimise contact with the sides of the tube. Using bigger boiling tubes would make this easier.
When making the beads I could also be more careful in trying to make them the same size.
I could extend the investigation by seeing what effect temperature and pH have on the effect of the breaking down of hydrogen peroxide into water and oxygen.
The Effects of Substrate Concentration on the Activity of Catalase
Planning:
Prediction:
As the concentration of hydrogen peroxide increases then the rate of reaction (1/t) will increase.
Biological Theory:
Catalase behaves as a catalyst for the conversion of hydrogen peroxide into water and oxygen and is able to speed up the reaction because the shape of its active site matches the shape of the hydrogen peroxide molecule.
As the concentration of hydrogen peroxide increases, there is more substrate to fit into the active sites of the enzyme, catalase. Also, the chances of the substrate entering an active site will increase. If the amount of enzyme remains constant, the rate of reaction will increase up to a point. The rate of reaction increases until all of the active sites of the enzyme molecule are being used. If excess substrate is added, the rate of reaction will not increase any further because the enzyme is working as fast as it can. At this point, Vmax is constant. Vmax is the maximum rate at which chemical reactions can occur (V = velocity).
The rate of an enzyme controlled reaction increase in proportion to the concentration of the enzyme (assuming there is excess substrate). If substrate is not in excess (e.g. constant) the graph tales off as it comes to a point where the reaction reaches maximum velocity, Vmax.
The chemical equation for the breaking down of hydrogen peroxide into water and oxygen is as follows:
This reaction is performed by two types of reactions called oxidation (losing electrons) and reduction (gaining electrons). Catalase functions by removing an electron from a molecule of hydrogen peroxide (H2O2) to form a water molecule (H2O) and an oxygen molecule (O2).
Apparatus and Materials:
Apparatus / material
Purpose
Justification
Ten Boiling tubes
Diluted hydrogen peroxide of concentrations 1.0%, 2.0%, 3.0%, 4.0%, 5.0%, 6.0%, 7.0%, 8.0%, 9.0% and 10.0%
A burette
Catalase solution
One 50 cm3 beaker
Stopwatch
Labelling pen
Twelve filter paper discs
Metal forceps
Contains hydrogen peroxide
A wide range of concentrations are required
To measure out the hydrogen peroxide
To dip filter paper discs in
Contains catalase solution
To time how long it takes the disc to rise
To label which boiling tube contains which concentration of hydrogen peroxide
To dip in catalase
To dip filter paper discs in catalase
Hydrogen peroxide must be contained for anything to be placed in it.
This wide range of concentrations will allow me to draw up a strong graph and make firm conclusions
This is more accurate than using a measuring cylinder
Required for chosen experiment
Required in order to dip filter paper discs in it
More accurate than counting in your head
To avoid making any mistakes by confusing which boiling tubs contain which concentration
Results obtained are more accurate than those obtained from using sodium alginate beads
Using fingers could negatively affect my results if any chemicals were on them.
Diagrams:
Method:
Here is a dilution table showing how to obtain all the concentrations of hydrogen peroxide that I am using:
Concentration %
Total volume
% of original hydrogen peroxide solution
Ratio
Volume of water
Volume of hydrogen peroxide
2
3
4
5
6
7
8
9
0
25
25
25
25
25
25
25
25
25
25
6
6
6
6
6
6
2
2
2
2
/6
2/6
3/6
4/6
5/6
7/12
8/12
9/12
0/12
20.8
6.7
2.5
8.3
4.2
0
0.4
8.3
6.25
4.2
4.2
8.3
2.5
6.7
20.8
25
4.6
6.7
8.75
20.8
First, add 25 cm3 of H202 (of strengths 1.0%, 2.0%, 3.0%, 4.0%, 5.0%, 6.0%, 7.0%, 8.0%, 9.0% and 10.0%) to ten boiling tubes using a burette. In order to get the correct concentration, make up the hydrogen peroxide solution as shown in the table above. To get the hydrogen peroxide into toe boiling tubes place the hydrogen peroxide into the burette filling it up to the correct level. When it is at the correct level, place a boiling tube under the bottom of the burette and open the tap. Allow all the hydrogen peroxide to leave the burette. Repeat this for each concentration. Next, label each tube. Take a filter paper disc and dip it in the catalase solution. Add the filter paper disc to one boiling tube using metal forceps. When the disc reaches the bottom of the tube or its lowest point, start the stopwatch. Stop the stopwatch when this disc reaches the surface of the solution. Repeat this a further two times, collecting three readings for each strength of H202. Lastly, record the results in a table.
Justification of number and type of measurements:
The different concentrations I have chosen allow me to draw up a strong graph and allow me to collect enough data to definitely accept / reject my prediction. My choosing the concentrations I will also collect reliable and good quality data that is needed to draw firm conclusions. The concentrations are not weak enough so that I will be waiting a long time for the filter paper disc to rise nor strong enough so that I cannot see the filter papers rise because it rises too fast.
I will be carrying out three repeats because this will enable me to calculate a good average. Although more repeats would enable me to calculate a better average, due to time constraints I will be unable to do this. This is the maximum number of repeats that I will be able to fit into the time given.
Using a burette is more accurate than using a measuring cylinder. When conducting the preliminary work, I found that there was a noticeable difference in the volume of hydrogen peroxide contained in the boiling tubes. Using a burette should solve this problem.
Risk assessment:
Solutions of hydrogen peroxide stronger than 5% are irritants to the eyes and skin so care must be take when handling it and eye protection must be worn at all times. Because I will be using concentrations of hydrogen peroxide up to 10%, extra care must be taken.
If the hydrogen peroxide is swallowed, the mouth must be washed out and a glass or two of water must be taken. Medical attention must be found as soon as possible.
If the hydrogen peroxide gets in the eyes, the eye must be gently flooded with tap water for 10 minutes and medical attention must be sought.
If the hydrogen peroxide gets on the skin, the affected area must be immediately washed under a tap.
In this experiment glassware will be handled so care should be take when around the burettes or beakers to avoid any breakages. If a breakage occurs, the glass must be cleaned up and disposed of.