I am going to test the two variables concentration and temperature. Both of these are independent, continuous variables. I think that concentration will have the biggest affect because the reaction is exothermic. Therefore even while I am testing concentration, heat will be given out by the reaction which will give more energy to the particles and so cause them to reach their activation energy sooner. In addition to this, looking at the original equation, it becomes clear that for every one mole of sodium thiosulphate, you need two moles of hydrochloric acid. Therefore increasing the number of hydrochloric acid particles will have a greater effect than if one were to increase levels of sodium thiosulphate.
I think that both concentration and energy are proportional because:
- doubling the number of particles doubles the probability that they will collide
and
- doubling the speed at which these particles travel will double the distance they can travel in a set time and so double the probability of them colliding.
This proportionality can be expressed using algebra thus: X' = XY' / Y
To carry out this experiment, I will need the following equipment:
A3020 computer, light sensor, beaker, distilled water, sodium thiosulphate, hydrochloric acid (stock bottle), electronic scales, thermometer, burette, light, black paper, bunsen burner, tripod, mat.
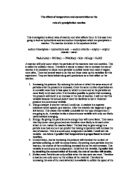
Firstly I shall test the variable "concentration of HCl", testing five different strengths. I shall set up the equipment as in the diagram below completely surrounding the light sensor with paper to ensure that the only light which reaches it passes through the beaker containing the reactants. As the reaction progresses, the sulphur will collect in the water and form a cloudy solution. As more sulphur is formed, less light can get through the solution and reach the sensor. I will put the hydrochloric acid into the beaker and prepare the computer. I shall then put the sodium thiosulphate into the beaker and start the computer reading. The computer records light levels as a percentage of original levels against time and is much more accurate than using a stop watch. I shall allow the reaction to take place for 60 seconds. I shall then use the computer's accurate analysis facility to record how long it took for light levels to fall to 60% of the original.
Often one of the possible weaknesses in an experiment such as this is that the different concentrations of acid are often made up inaccurately. To solve this problem I shall use one large bottle of 0.5 molar hydrochloric acid and use distilled water to dilute it to different concentrations: 20, 40, 60, 80, and 100% acid. Because I need 20ml of acid and 20ml of sodium thiosulphate I shall use varying quantities of water. For example, when making 20% concentration, I shall mix the water and acid 16ml/0.25ml respectively. After the experiment, I shall be able to draw a graph comparing concentration and reaction time. If my prediction is correct, the graph will be proportional. I shall back up my results for this section by using results generated by another group using the optical method outlined in the plan for the second variable below.
To test the second variable "temperature of HCl" I will again make up my own HCl but in this case I will only take two molar samples. This time I will make four 20ml samples and put them in individual beakers. I will heat the beakers to temps of 20, 40, 60, and 80 degrees centigrade. Here I recognise that degrees centigrade are not the most preferable units as 40 degrees doesn't give double the energy to 20 degrees. However the school cannot go low or high enough to make use of the kelvin scale. Despite this, if the prediction is correct and it is proportional, I should still be able to tell from the ensuing graph.
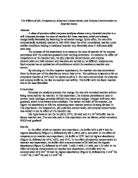
Because there aren't enough computers for me to test my second variable using this method, I shall use an optical method. I shall set up the equipment as in the diagram below, drawing a black cross on a piece of paper and setting it on a heat proof mat. I shall take each beaker in turn, having heated the hydrochloric acid to the correct temperature on a bunsen burner, and place it on the mat over the cross. I shall then add 20ml of sodium thiosulphate and start a stopwatch simultaneously. I shall stop the watch when it is no longer possible to see the cross. I shall test each temperature three times and then take an average to ensure that the result is balanced and not just a result of a fluke.
Doing
I conducted the experiment as per my plan, although I had to disregard the first few computer results as the system took a while to configure. However I did several things to ensure the accuracy of my project. These included:
- Washing out the glassware with distilled water before use and between measurements. This was designed to prevent any foreign ions getting into the solution as this could damage the results.
- Using an analogue thermometer when heating the hydrochloric acid as this enables me to be more accurate than with a digital thermometer.
- Using a small measuring cylinder and funnel when measuring out hydrochloric acid, water, and sodium thiosulphate rather than using beakers.
The results for the first variable are displayed in Table 1 below. There was only time to take measurements once for each concentration as other groups needed to use the computer. However because the computer is very accurate and because I also took results from another group, this will not pose too great a problem.
The results for fellow pupil Claire Robinson, testing the same variable are shown in Table 2. These results are included to back up the computer generated results. It is clear that in general they follow the pattern set by my results although each time her reaction took a little longer. This could be explained by the fact that she was using the optical method and so would be less accurate. The final (100%) however seems to be an anomaly. The reaction is actually slower than for 80% concentration. This could be explained by foreign ions in the solution or of inaccuracies in measuring out the different reactants.
Finally, Table 3 shows the results for the variable temperature which was again tested using the optical method. Once more the final reading doesn't follow the pattern set by the others. However with this variable, the speed of the reaction is so fast that the cross disappears almost instantaneously and so the time reading is likely to be inaccurate.
Conclusions
Before I can represent my data in graph form and then test my prediction, I have to look at the way the data is laid out. I predicted that both variables would be proportional. This implies that as temperature goes up, time taken goes down. However because reaction time goes down, reaction rate is actually increasing. The best way therefore to represent the results in graph form is to draw a graph of concentration/temperature against the reciprocal of the time taken.
Graph 1 shows concentration against the reciprocal of the time. However it is clear that it is not a straight line graph but rather a curve, gradually getting steeper as molarity increases. It is clear that my prediction was wrong and that the graph is not proportional. I can further test this by running my results through the formula for proportionality.
X = XY' / Y
so
X' = (0.056 x 60) / 20 = 0.168
If my prediction was correct the reciprocal of time taken for 60% concentration should be 0.168. In fact it is 0.09. The slow growth of the graph followed by a massive increase can be explained by looking at activation energy. All of the reactions happened at room temperature (about 210C). Clearly this energy was only enough to push some of the particles beyond their activation energy. However because the reaction is exothermic it gives out energy and this energy pushes more particles to activation energy and these in turn release more heat. More particles of HCI available to reaction with the sodium thiosulphate means more heat given out and more particles being pushed to activation energy.
Graph 2 is much steeper with a massive leap between the temperatures of 40 and 60°C. However after 60° it then falls. This is because of a problem with gathering the data. However even the parts of the graph below 60° do not seem to be proportional. I tested this by running them through the formula remembering to use Kelvin rather than centigrade.
X' = (0.8 x 333) / 293 = 0.9
If the results were proportional, then the reciprocal of time taken for 333K would be 0.9. However it is in fact 1.33. Therefore this prediction was also wrong. This very steep graph can be explained by saying that were plenty of both reactants in the solutions tested. In fact there was enough to support a much faster reaction than the one which occurred. Because there were enough particles, the most important factor became the activation energy. By 40° many of the particles had reached activation energy. They then gave out heat themselves and so speeded up the reaction causing the large increase after 40°. If it had been possible to test 80° on the computer, I might be able to see the temperature at which all of the particles have reacted and the reaction stops. However the collision theory can still be applied to both variables because when temp/concentration increases, so does reaction rate.
Although I predicted that concentration would have the greatest affect on the reaction rate, it was in fact temperature. This was mainly because the concentration was tested at room temperature which wasn't enough to get many of the particles to activation energy levels. In addition, in the solution there was plenty of particles so concentration wasn't important.
The investigation could have been improved by testing the temperature variable on the computer as the stop watch I used could not cope with the speed of the reaction. It would also have helped to test each concentration more than once to ensure that the results were true. When using the light sensor I should have covered the underside of the sensor with black material rather than sticking on paper as this could have let in some light. In addition I should have used an artificial source of light as the natural light in the room was constantly changing as clouds pass in front of the sun. I could also have used a burette to measure out the reactants although the measuring cylinder was quite accurate.